


Telomere shortening and DNA oxidation are associated with premature vascular aging, which may be involved in lower-extremity amputation (LEA). We sought to investigate whether leukocyte telomere length (LTL) and plasma 8-hydroxy-2′-deoxyguanosine (8-OHdG), a biomarker of DNA oxidation, were associated with LEA in subjects with type 1 diabetes at high vascular risk.
LTL (quantitative PCR) and plasma 8-OHdG concentrations (immunoassay method) were assessed at baseline in the GENEDIAB (Génétique de la Néphropathie Diabétique) type 1 diabetes cohort. Logistic and Cox proportional hazards regression models were fitted to estimate odds ratio (OR) (at baseline) and hazard ratio (HR) (during follow-up), with related 95% CI, by increasing biomarker tertiles (T1, T2, T3).
Among 478 participants (56% male, mean ± SD age 45 ± 12 years and diabetes duration 29 ± 10 years), 84 patients had LEA at baseline. Baseline history of LEA was associated with shorter LTL (OR for T2 vs. T1 0.62 [95% CI 0.32–1.22] and for T3 vs. T1 0.41 [0.20–0.84]) but not with plasma 8-OHdG (1.16 [0.56–2.39] and 1.24 [0.61–2.55], respectively). New cases of LEA occurred in 34 (12.3%) participants during the 10-year follow-up. LTL were shorter (HR T2 vs. T1 0.25 [95% CI 0.08–0.67] and T3 vs. T1 0.29 [0.10–0.77]) and plasma 8-OHdG higher (2.20 [0.76–7.35] and 3.11 [1.07–10.32]) in participants who developed LEA during follow-up compared with others. No significant interaction was observed between biomarkers on their association with LEA.
We report the first independent association between LTL shortening and excess risk of LEA in type 1 diabetes. High plasma 8-OHdG was also associated with incident LEA but partly dependent on cofounding variables.
Introduction
Type 1 diabetes is associated with accelerated vascular aging and advanced atherosclerosis resulting in increased rates of cardiovascular disease and premature death (1,2). Lower-extremity amputation (LEA) is one of the most frequent and severe complications in patients with diabetes (3). It is associated with worse cardiovascular and overall outcomes, lengthy and iterative hospitalizations, and physical and psychological sequelae with a negative impact on quality of life (4–6).
Oxidative stress, resulting in increased reactive oxygen species (ROS) production with decreased antioxidant capacity (7), plays an important role in the pathogenesis of accelerated atherosclerosis (8). DNA oxidation has been associated with a wide range of damage, including cellular senescence and apoptosis (9). The 8-hydroxy-2′-deoxyguanosine (8-OHdG) is a product of oxidative DNA damage, resulting in excision of oxidated guanosine in mitochondrial and nuclear DNA by the base excision and repair system (10). It is excreted in the plasma and urine, where it can easily be measured. Thus, 8-OHdG has been used as a biomarker of oxidative DNA damage (11). Previous studies have shown higher plasma and urinary concentrations of 8-OHdG in patients with type 2 diabetes compared with healthy control subjects (12–14). Plasma and urinary concentrations of 8-OHdG were also increased in patients with cardiovascular disease compared with those free of this condition (15).
Telomeres are DNA-protein structures playing a major role in the protection of chromosomes against fusion and degradation (16). Telomere shortening and dysfunction may be involved in the senescence and the development of age-related diseases (17). Oxidative stress may contribute to telomere shortening in some pathological conditions including diabetes and vascular disease (18). Previous studies have shown association between telomere shortening and growing incidence of diabetes (19), but few have been done in terms of vascular complications in people with diabetes (20,21), especially those responsible for lower-limb loss. The purpose of the current study was to investigate whether telomere length and DNA oxidation were associated with risk of LEA in patients with type 1 diabetes. Therefore, we measured relative leukocyte telomere length (LTL) and plasma concentrations of 8-OHdG at baseline in a prospective cohort of subjects with long-standing type 1 diabetes at high risk of vascular complications.
Research Design and Methods
Study Participants
GENEDIAB (Génétique de la Néphropathie Diabétique) was a multicenter, binational (Belgium and France) prospective study conducted from 1994 to 2006, with 521 participants with type 1 diabetes (22). In the current study, we investigated 478 participants for whom DNA (N = 403 for LTL measurement) or plasma (N = 442 for 8-OHdG assessment) samples were available at baseline. In the prospective study, 274 participants (227 and 257 among those with available DNA and plasma samples, respectively) were followed, at least once, until an end point was reached or until February 2007 (Supplementary Fig. 1). The study protocol was approved by the Ethics Committee of Angers University Hospital (Angers, France), and all participants gave written informed consent.
Definition of Clinical Parameters and Outcomes
History of diabetic kidney disease (DKD) was defined as estimated glomerular filtration rate (eGFR) (computed using the Chronic Kidney Disease Epidemiology Collaboration equation) <60 mL/min/1.73 m2 or urinary albumin concentration (UAC) >30 mg/24 h. LEA was defined by minor (toes or transmetatarsal) or major (above or below the knee) amputation resulting from nontraumatic causes. Macrovascular disease was defined at baseline as coronary artery disease (angina, myocardial infarction, or requirement of coronary revascularization) or cerebrovascular disease (stroke or requirement of carotid revascularization). Peripheral diabetic neuropathy and lower-extremity artery disease were collected at baseline; their definitions were based on investigator discretion. The main outcome of interest during follow-up was the occurrence of new cases of LEA, with the similar definition used at baseline (see above). An independent adjudication committee validated the diagnosis of vascular complications including LEA at baseline and during follow-up.
Measurement of LTL
LTL were measured in triplicate on DNA samples collected at baseline and kept frozen at −80°C. We used relative quantification by PCR adapted from the method described by Cawthon (23) in 2002 to determine the relative telomere–to–single copy gene (T/S) ratio. The DNA of a control subject without diabetes was used as a calibrator and measured in every plate to allow the interplate comparisons. The primers described in 2009 by Cawthon (24) were used for telomere amplification: TEL-G, CACTAAGGTTTGGGTTTGGGTTTGGGTTTGGGTTAGTGT, and TEL-C, TGTTAGGTATCCCTATCCCTATCCCTATCCCTATCCCTAACA.
The TEL-G and TEL-C primers were diluted at 100 and 300 nmol/L concentrations, respectively. The GAPDH gene was used as the single copy gene. PCR preparation was set up by mixing 1.5 µL DNA sample at 2.5 ng/µL concentration with 1.5 µL water, 5 µL SYBR Green I Master, and 1 µL each type of a couple of primers (forward and reverse). DNA was replaced by water in the negative control subjects. PCRs were assessed on a LightCycler 480 (Roche Life Science) using the thermic cycling as follows: after a common activation phase at 95°C for 10 min, samples were submitted to 35 cycles with 95°C for 5 s and then 59°C for 10 s followed by 72°C for 2 min for telomere amplification and 95°C for 10 s, and then 62°C for 15 s followed by 72°C for 15 s for the GAPDH gene. According to previously described methods (25,26), the T/S ratio was estimated after correction of the difference in PCR efficiency (E) between telomere and reference gene amplification as follow: T/S = E(telomere)ΔCt telomeres/E(GAPDH)ΔCt GAPDH. The efficiencies of the two PCRs (telomere and reference genes) were estimated using standard curves and the formula E = 10−1/slope, and the ΔCt represented the difference between the thresholds (Ct) at which the fluorescence was detected by the machine, for the calibrator and the participant samples during telomeres and reference gene amplifications, respectively.
Measurement of Plasma Concentrations of 8-OHdG
As previously reported (27), plasma concentrations of 8-OHdG were measured in duplicate on plasma samples collected at baseline and kept frozen at −80°C. We used an immunoassay method (cat. no. ADI-EKS-350, DNA Damages EIA Kit; Enzo Life Sciences) and optical density reader (NanoQuant Infinite M200 Pro; Tecan). The sensitivity of the assay for determination of plasma concentrations of 8-OHdG was 0.59 ng/mL, and the intra-assay and interassay precision was determined to be <10%. Specificity analysis found a proportion of cross-reactivity <0.016% with intact guanosine or other compounds derived from guanosine, except for 8-mercaptoguanosine (3.5% of cross-reactivity).
Statistical Analysis
Categorical variables were expressed as number of participants with corresponding percentage. Continuous variables were expressed as mean ± SD or, for those with skewed distribution, as median with 25th and 75th percentiles. Correlation between LTL and plasma 8-OHdG was tested using Spearman rank coefficient. Participants were categorized into three equally sized groups corresponding to increasing tertiles (first tertile, T1; second, T2; and third, T3) from the shortest to the longest LTL or from the lowest to the highest 8-OHdG concentrations.
Characteristics of participants at baseline were compared using χ2, ANOVA, Wilcoxon, or Kruskal-Wallis tests. A logistic regression model was used to test the associations between LTL or plasma 8-OHdG and the history of LEA at baseline, expressed as odds ratio (OR) with related 95% CI. Kaplan Meier curves were plotted to evaluate survival free of LEA during follow-up by LTL or 8-OHdG tertiles at baseline and compared using the log-rank test. Cox proportional hazards regression models were fitted to estimate hazard ratio (HR), with associated 95% CI, for the risk of LEA during follow-up according to tertiles of biomarkers at baseline. Analyses were adjusted for relevant confounding variables at baseline: age, sex, and duration of diabetes (model 1), plus BMI, HbA1c, systolic blood pressure (SBP), diastolic blood pressure (DBP), use of antihypertensive, aspirin, and lipid-lowering drugs, and history of current smoking, proliferative retinopathy, DKD, and macrovascular disease (model 2). The Schoenfeld residuals method was used to check the proportional hazards assumption for LTL-LEA (P = 0.35) or 8-OHdG–LEA association (P = 0.78).
The independence between LTL and 8-OHdG for the associations with LEA was tested by two different methods: first, by including 8-OHdG or LTL as a covariate in the regression model for the LTL-LEA or 8-OHdG–LEA association, respectively, and second, by including a multiplicative interaction term, 8-OHdG * LTL, in the regression model.
We performed a series of sensitivity analyses: first, to assess the interactions between baseline covariates (sex, age, and duration of diabetes) and 8-OHdG or LTL on their associations with LEA during follow-up; second, to estimate subhazard ratios for LEA while accounting for the competing risk of all-cause mortality using the competing risk model of Fine and Gray; third, to test the association between biomarkers and the risk of recurrent LEA (history at baseline with occurrence of incident cases during follow-up); fourth, to test the association between 8-OHdG and LTL and the history of peripheral diabetic neuropathy or lower-extremity artery disease at baseline using the logistic regression analyses, adjusting as in model 2; and finally, to test the association between 8-OHdG or LTL and the risk of LEA after adjusting for baseline history of peripheral diabetic neuropathy and lower-extremity artery disease in addition to model 2.
Statistics were performed using JMP Pro 14 SW software (SAS Institute, Cary, NC) and Stata software, version 13 (StataCorp [www.stata.com]). Two-sided P values <0.05 were considered significant.
Results
Characteristics of Participants at Baseline
The mean ± SD age and duration of diabetes at baseline were 45 ± 12 and 29 ± 10 years, respectively, and 56% of participants were men. Proliferative retinopathy, DKD, and coronary artery disease were present at baseline in 82%, 68%, and 12% of participants, respectively (Supplementary Table 1). Eighty-four (18%) participants had a history of LEA at baseline. Participants who had a history of LEA at baseline, compared with those who did not, were older, more frequently men, and had a longer duration of diabetes, a higher SBP, and a lower eGFR (Supplementary Table 1). They also presented more frequent history of DKD, peripheral diabetic neuropathy, macrovascular disease, and lower-extremity artery disease and were more likely to use antihypertensive drugs and aspirin. The shorter LTL, compared with the longest, was significantly associated with history of lower-extremity artery disease after adjustment as in model 2 (OR for T2 vs. T1 0.75 [95% CI 0.38–1.47], P = 0.40; T3 vs. T1 0.47 [0.23–0.97], P = 0.04). However, no significant association was observed between 8-OHdG concentrations and the history of lower-extremity artery disease at baseline (Supplementary Table 2). Also, LTL and 8-OHdG were not significantly associated with the history of peripheral diabetic neuropathy (Supplementary Table 3).
History of LEA by LTL and Plasma 8-OHdG at Baseline
The medians of LTL and plasma 8-OHdG were 1.39 ng/mL (25th percentile 0.98, 75th percentile 2.04) and 9.4 ng/mL (5.6, 15.8), respectively. No significant correlation was observed between LTL and plasma 8-OHdG (P = 0.71). Participants with the shorter telomeres were older at baseline and more commonly had a history of lower-extremity artery disease compared with those with the longest LTL. Otherwise, characteristics of participants were comparable across LTL tertiles (Table 1). Participants within the highest 8-OHdG tertile, compared with those within the lowest, had higher SBP, DBP, and UAC; had a lower eGFR; had more prevalent DKD, coronary artery disease, and lower-extremity artery disease; and were more likely to use antihypertensive drugs and aspirin (Table 1).
Characteristics of participants by tertiles of LTL and plasma 8-OHdG at baseline
| Tertiles of LTL | P | Tertiles of 8-OHdG | P | |||||
|---|---|---|---|---|---|---|---|---|
| T1 | T2 | T3 | T1 | T2 | T3 | |||
| N | 134 | 134 | 135 | 147 | 147 | 148 | ||
| Clinical and biological data | ||||||||
| Age (years) | 47 ± 12 | 44 ± 12 | 42 ± 13 | 0.02 | 43 ± 12 | 46 ± 13 | 45 ± 12 | 0.14 |
| Male sex | 78 (58) | 78 (58) | 69 (51) | 0.40 | 83 (56) | 76 (52) | 87 (59) | 0.46 |
| Current smoking | 37 (28) | 30 (22) | 34 (25) | 0.61 | 39 (27) | 43 (29) | 34 (23) | 0.47 |
| Duration of diabetes (years) | 29 ± 9 | 29 ± 10 | 28 ± 10 | 0.51 | 29 ± 10 | 29 ± 10 | 29 ± 9 | 0.74 |
| BMI (kg/m2) | 24 ± 4 | 24 ± 3 | 23 ± 3 | 0.09 | 24 ± 3 | 24 ± 3 | 24 ± 3 | 0.79 |
| SBP (mmHg) | 137 ± 19 | 138 ± 17 | 139 ± 20 | 0.73 | 134 ± 17 | 137 ± 16 | 143 ± 22 | <0.001 |
| DBP (mmHg) | 79 ± 12 | 78 ± 11 | 81 ± 13 | 0.24 | 76 ± 11 | 79 ± 9 | 82 ± 13 | <0.001 |
| HbA1c (mmol/mol) | 71 ± 19 | 68 ± 15 | 72 ± 20 | 0.11 | 70 ± 17 | 73 ± 20 | 70 ± 20 | 0.28 |
| HbA1c (%) | 8.7 ± 1.7 | 8.4 ± 1.4 | 8.8 ± 1.9 | 8.6 ± 1.5 | 8.8 ± 1.8 | 8.5 ± 1.8 | ||
| eGFR (mL/min/1.73 m2) | 70 ± 31 | 75 ± 38 | 68 ± 33 | 0.26 | 79 ± 24 | 78 ± 37 | 56 ± 29 | <0.001 |
| UAC (mg/L) | 45 (7, 345) | 33 (7, 478) | 36 (8, 501) | 0.89 | 19 (6, 95) | 27 (6, 257) | 164 (10, 921) | <0.001 |
| Total cholesterol (mg/dL) | 2.2 ± 0.6 | 2.3 ± 0.5 | 2.1 ± 0.5 | 0.21 | 2.2 ± 0.5 | 2.2 ± 0.5 | 2.3 ± 0.6 | 0.33 |
| History of microvascular disease | ||||||||
| Proliferative retinopathy | 105 (78) | 112 (84) | 110 (81) | 0.55 | 118 (80) | 124 (84) | 122 (82) | 0.66 |
| DKD | 91 (68) | 84 (63) | 99 (73) | 0.17 | 81 (55) | 96 (65) | 120 (81) | <0.001 |
| Peripheral diabetic neuropathy | 98 (73) | 86 (64) | 84 (62) | 0.13 | 94 (64) | 97 (66) | 106 (72) | 0.35 |
| History of macrovascular disease | ||||||||
| Coronary artery disease | 25 (19) | 15 (11) | 13 (10) | 0.06 | 8 (5) | 22 (15) | 23 (16) | 0.01 |
| Cerebrovascular artery disease | 6 (5) | 6 (5) | 8 (6) | 0.82 | 7 (5) | 4 (3) | 11 (7) | 0.18 |
| Lower-extremity artery disease | 34 (26) | 24 (18) | 18 (14) | 0.04 | 17 (12) | 34 (23) | 33 (22) | 0.02 |
| History of treatments | ||||||||
| Antihypertensive drugs | 75 (56) | 80 (60) | 78 (58) | 0.83 | 72 (49) | 81 (55) | 104 (70) | 0.001 |
| Lipid-lowering drugs | 11 (8) | 12 (9) | 9 (7) | 0.78 | 9 (6) | 15 (10) | 16 (11) | 0.31 |
| Aspirin | 22 (16) | 17 (13) | 19 (14) | 0.68 | 13 (9) | 21 (14) | 30 (20) | 0.02 |
Qualitative and quantitative parameters are expressed as numbers (percentage) and means ± SD, respectively, except for the UAC, expressed as median (25th, 75th percentiles). Comparisons were performed using χ2, ANOVA, or Kruskal-Wallis tests. P < 0.05 was significant.
Participants who had a history of LEA at baseline, compared with those who did not, had significantly shorter LTL (median 1.15 [25th percentile 0.81, 75th percentile 1.70] vs. 1.46 [1.02, 2.18], respectively, P = 0.004) and higher plasma 8-OHdG concentrations (11.7 ng/mL [7.7, 18.7] vs. 9.0 [5.2, 15.4], P = 0.003). The prevalence of LEA increased with shortening LTL (12.6%, 16.4%, and 26.1% in T3, T2, and T1, respectively; P = 0.01) and increasing 8-OHdG concentrations (12.2%, 19.7%, and 21.6% in T1, T2, and T3; P = 0.08). The shorter LTL, compared with the longest one, remained significantly associated with a higher prevalence of LEA after multiple adjustments: OR for T2 vs. T1 0.62 (95% CI 0.32–1.22), P = 0.17, and T3 vs. T1 0.41 (0.20–0.84), P = 0.01 (Table 2). The association between baseline history of LEA and elevated 8-OHdG concentrations was significant in the simple adjusted model 1 but not in the multiadjusted model 2: T2 vs. T1 1.16 (0.56–2.39), P = 0.68, and T3 vs. T1 1.24 (0.61–2.55), P = 0.55 (Table 2).
Association between LTL or plasma concentrations of 8-OHdG and history of LEA at baseline
| Baseline history of LEA | Model 1 | Model 2 | ||||
|---|---|---|---|---|---|---|
| No, n | Yes, n (%) | OR (95% CI) | P | OR (95% CI) | P | |
| Tertiles of LTL | ||||||
| T1 | 99 | 35 (26.1) | Ref. | Ref. | ||
| T2 | 112 | 22 (16.4) | 0.57 (0.30–1.07) | 0.08 | 0.62 (0.32–1.22) | 0.17 |
| T3 | 118 | 17 (12.6) | 0.45 (0.22–0.88) | 0.02 | 0.41 (0.20–0.84) | 0.01 |
| Tertiles of 8-OHdG | ||||||
| T1 | 129 | 18 (12.2) | Ref. | Ref. | ||
| T2 | 118 | 29 (19.7) | 1.64 (0.84–3.23) | 0.14 | 1.16 (0.56–2.39) | 0.68 |
| T3 | 116 | 32 (21.6) | 1.98 (1.04–3.87) | 0.04 | 1.24 (0.61–2.55) | 0.55 |
ORs (95% CI) for baseline history of LEA in T2 vs. T1 and T3 vs. T1 estimated using logistic regression analyses adjusting for age, sex, and duration of diabetes (model 1), plus HbA1c; BMI; SBP; DBP; use of antihypertensive, aspirin, and lipid-lowering drugs; and history of current smoking, proliferative retinopathy, DKD, and macrovascular disease at baseline (model 2). P < 0.05 was significant. Ref., reference.
Incidence of LEA During Follow-up by LTL and Plasma Concentrations of 8-OHdG at Baseline
During a median duration of follow-up of 10.2 years (25th percentile 7.8, 75th percentile 10.8), LEA occurred in 34 (12.3%) participants, with an incidence rate of 1.2 per 100 person-years. Participants who developed LEA during follow-up, compared with those who did not, had a higher HbA1c and more frequent history of diabetic peripheral neuropathy and lower-extremity artery disease and were more likely to use antihypertensive drugs at baseline (Supplementary Table 1). LTL was shorter (0.95 [0.59, 1.73] vs. 1.35 [1.01, 1.96], P = 0.02) and plasma 8-OHdG concentrations were higher (12.3 ng/mL [8.6, 16.7] vs. 8.5 ng/mL [5.0, 14.0], P = 0.01) in participants who developed LEA during follow-up compared with those who did not. The Kaplan-Meier estimate of the 10-year cumulative incidence of LEA was higher for those with shorter LTL (T3 7%, T2 6%, and T1 23%; P = 0.002) and the highest 8-OHdG concentrations (T1 6%, T2 14%, and T3 15%; P = 0.05) (Fig. 1). The Cox model confirmed the associations between LTL tertiles (HR for T2 vs. T1 0.25 [95% CI 0.08–0.67], P = 0.005, and T3 vs. T1 0.29 [0.10–0.77], P = 0.01) (Table 3) (model 2). The risk of LEA remained significantly higher in the highest versus the lowest 8-OHdG tertile (T2 vs. T1 2.20 [0.76–7.35], P = 0.15, and T3 vs. T1 3.11 [1.07–10.32], P = 0.04) in the multiadjusted model (Table 3) (model 2).
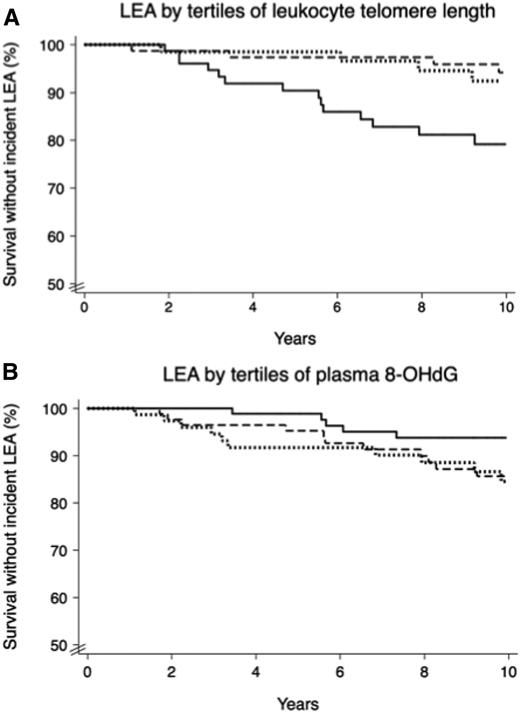
LEA during follow-up by tertiles of LTL or plasma concentrations of 8-OHdG at baseline. Probability of survival without new cases of LEA in the first (solid line), second (dashed line), and third (dotted line) tertiles of LTL (A) (P = 0.002) or 8-OHdG (B) (P = 0.05).
LEA during follow-up by tertiles of LTL or plasma concentrations of 8-OHdG at baseline. Probability of survival without new cases of LEA in the first (solid line), second (dashed line), and third (dotted line) tertiles of LTL (A) (P = 0.002) or 8-OHdG (B) (P = 0.05).
Association between LTL or plasma concentrations of 8-OHdG at baseline and incidence of LEA during follow-up
| New cases of LEA during follow-up | Model 1 | Model 2 | ||||
|---|---|---|---|---|---|---|
| No, n | Yes, n (%) | HR (95% CI) | P | HR (95% CI) | P | |
| Tertiles of LTL | ||||||
| T1 | 63 | 17 (21.2) | Ref. | Ref. | ||
| T2 | 74 | 5 (6.3) | 0.24 (0.08–0.61) | 0.002 | 0.25 (0.08–0.67) | 0.005 |
| T3 | 64 | 6 (8.6) | 0.40 (0.14–0.96) | 0.04 | 0.29 (0.10–0.77) | 0.01 |
| Tertiles of 8-OHdG | ||||||
| T1 | 87 | 5 (5.4) | Ref. | Ref. | ||
| T2 | 77 | 13 (14.4) | 2.65 (0.98–8.40) | 0.05 | 2.20 (0.76–7.35) | 0.15 |
| T3 | 64 | 13 (16.9) | 3.08 (1.14–9.69) | 0.03 | 3.11 (1.07–10.32) | 0.04 |
HRs (95% CI) for incident LEA in T2 vs. T1 and T3 vs. T1 estimated using Cox proportional hazards regression models adjusting for age, sex, and duration of diabetes (model 1), plus HbA1c; BMI; SBP; DBP; use of antihypertensive, aspirin, and lipid-lowering drugs; and history of current smoking, proliferative retinopathy, DKD, and macrovascular disease at baseline (model 2). P < 0.05 was significant.
Independence Between LTL and Plasma 8-OHdG in the Risk of LEA During Follow-up
The association between LTL and risk of LEA was similar after adjustment for plasma concentrations of 8-OHdG in addition to model 2 (T2 vs. T1 HR 0.28 [95% CI 0.09–0.80], P = 0.02, and T3 vs. T1 0.33 [0.11–0.93], P = 0.03), while 8-OHdG–LEA association failed to reach the significant threshold after additional adjustment for LTL (T2 vs. T1 2.78 [0.77–11.96], P = 0.12, and T3 vs. T1 3.17 [0.93–12.88], P = 0.07). We did not observe significant interaction between the two biomarkers in their association with incident LEA (P = 0.33).
Sensitivity Analyses
Except for the significant interaction observed between plasma 8-OHdG and age (P = 0.01), no evidence for interaction was observed between biomarkers and sex, age, or duration of diabetes at baseline for the risk of LEA during follow-up (all P > 0.05). LTL-LEA associations were reliable after adjustment for all-cause death as a competing risk (T2 vs. T1 subhazard ratio 0.26 [95% CI 0.08–0.81], P = 0.02, and T3 vs. T1 0.26 [0.09–0.75], P = 0.01). However, 8-OHdG–LEA association did not remain significant after such adjustment (Supplementary Table 4). The association between LTL and risk of LEA remained significant after adjustment for baseline history of peripheral diabetic neuropathy and lower-extremity artery disease in addition to model 2 (T2 vs. T1 0.31 [0.09–0.88], P = 0.03, and T3 vs. T1 0.35 [0.11–0.96], P = 0.04). No significant association was observed between 8-OHdG and LEA after adjustment for baseline history of peripheral diabetic neuropathy and lower-extremity artery disease (T2 vs. T1 1.55 [0.49–5.47], P = 0.46, and T3 vs. T1 2.80 [0.88–10.14], P = 0.08). The shorter LTL, compared with the longest one, was significantly associated with the risk of recurrent LEA during follow-up (T2 vs. T1 0.43 [0.11–1.43], P = 0.17, and T3 vs. T1 0.14 [0.02–0.71], P = 0.02). No significant association was observed between 8-OHdG and recurrent LEA (T2 vs. T1 2.72 [0.72–13.31], P = 0.14, and T3 vs. T1 1.36 [0.27–7.82], P = 0.71).
Conclusions
In the current study, we observed associations between LTL shortening and increased prevalence at baseline and incidence during follow-up of LEA in patients with long-standing type 1 diabetes. These associations were independent of sex, age, duration of diabetes, and a range of relevant confounding variables including microvascular and macrovascular risk factors and conditions. These associations were not influenced by treating all-cause death as a competing risk. The association between LTL shortening and excess risk of LEA during follow-up remained significant after further adjustment for plasma concentrations of 8-OHdG, with no evidence for significant interaction between the two biomarkers. Furthermore, a significant association was observed between LTL shortening and recurrent LEA, which is a common, more severe, and challenging diabetes complication (28).
As far as we know, this is the first report of independent and reliable associations between telomere shortening and risk of LEA in patients with type 1 diabetes. Previous studies have reported a relationship between LTL shortening and cardiovascular disease (29), but no association was reported in terms of lower-limb loss and related causes in people with diabetes. In a case-control study including 490 Caucasian males (16% with diabetes), LTL shortening was associated with increased prevalence of symptomatic lower-extremity artery disease, defined as intermittent claudication (30). Comparable results were observed in a Chinese community-based case-control study including patients (<5% with diabetes) with more comprehensive diagnosis of lower-extremity artery disease (intermittent claudication or an ankle-brachial index ≤0.9) but with no assessment of LEA (31). In our study, the shorter LTL was associated with a higher prevalence of lower-extremity artery disease at baseline but not with peripheral neuropathy. Of note, the LTL-LEA association remained significant after adjustment for baseline history of lower-extremity artery disease and peripheral neuropathy, suggesting that other mechanisms may be involved in this relationship. Our finding may reflect excess risk of infectious disease in patients who experienced LEA. A recent study reported association between shorter LTL and excess risk of hospitalization due to any infection and pneumonia as well as related death (32). However, this study did not show significant association between LTL and risk of skin, bone, and joint infections, which are the main infectious complications likely to be accountable for LEA in patients with diabetes.
Previous studies have suggested association between plasma or urinary concentrations of 8-OHdG and kidney or cardiovascular disease in individuals with diabetes (27,33,34), but once again, no investigation of DNA oxidation has been reported in terms of LEA. In our study, we have observed association between high plasma concentrations of 8-OHdG and increased incidence of LEA during follow-up, but this association was not reliably independent, especially with adjustment for competitive risk of death, LTL, or baseline history of lower-extremity artery disease and peripheral neuropathy. Also, we did not find any evidence for interaction between LTL shortening and plasma 8-OHdG on the risk of LEA. Our study cannot exclude the involvement of other oxidative DNA damage, although 8-OHdG is considered the most common oxidative DNA product, as guanine has a lower one-electron reduction potential than the other nucleosides in DNA.
Our findings do not allow any etiological conclusion or determine the biological consequences of telomere length or DNA oxidation in the pathogenesis of LEA, although they may suggest potential involvement of LTL shortening in the occurrence of this complication in patients with long-standing type 1 diabetes. Overall, telomere-shortening mechanisms remain quite poorly understood. They involve a number of genetic, epigenetic, environmental, and pathological disorders including oxidative stress–mediated damage and inflammation, which may contribute to the risk of LEA (35). Excess ROS accelerates oxidative damage of DNA as well as other macromolecules including proteins and lipids (12). Previous studies have provided some evidence that telomere shortening and DNA oxidation may coexist in people with diabetes (36–38). In vitro studies suggest that excess ROS may accelerate telomere shortening by DNA oxidation in endothelial cells (39). Oxidative stress and telomere dysfunction contribute together to major DNA instability, leading to cell senescence (40). Our study may also support the hypothesis related to a threshold below which telomere shortening becomes critical and clinically relevant. Hence, the 10-year cumulative incidence of LEA was similar and dramatically lower in the second and third LTL tertiles (longest) compared with the first one (shortest). HRs and their 95% CIs were also similar in T2 versus T1 and T3 versus T1 comparisons.
Our work has several strengths including the investigation of patients with long-standing type 1 diabetes from a multicenter binational cohort, designed to investigate biochemical and genetic determinants of diabetic vascular complications. GENEDIAB has comprehensive clinical and biological data at baseline and prespecified vascular outcomes and survival status during 10-year follow-up. Our study tested two potential biomarkers for one of the most challenging and burdening complications in patients with type 1 diabetes. However, some limitations should be underlined. We did not have data regarding LEA levels (minor vs. major), which may have different associations with the measured biomarkers. Also, peripheral diabetic neuropathy and lower-extremity artery disease were collected at baseline according to investigator discretion, without evaluation of incident cases. Nevertheless, we can note that new cases of LEA occurred in 94% and 53% of participants with baseline history of peripheral diabetic neuropathy and lower-extremity artery disease, respectively (Supplementary Table 1); such distribution might be expected in patients with long-standing type 1 diabetes and severe diabetic retinopathy. Finally, our findings may not be representative of the population with type 2 diabetes or of all patients with type 1 diabetes, since the GENEDIAB cohort included only participants with type 1 diabetes and severe diabetic retinopathy.
In conclusion, this is the first report of independent and consistent association between relative LTL shortening and excess risk of nontraumatic LEA in patients with long-standing type 1 diabetes. The association between high plasma concentrations of 8-OHdG and risk of LEA was not reliably independent. Further etiological studies are needed to investigate the respective roles of telomere shortening and DNA oxidation in the physiopathology of lower-limb complications in people with diabetes.
Article Information
Funding. K.M. was supported by grants from the “Fibrosis, Inflammation, REmodeling in cardiovascular, respiratory and renal diseases” hospital and university department (DHU FIRE).
Duality of Interest. No potential conflicts of interest relevant to this article were reported.
Author Contributions. M.S. and K.M. designed the study, researched data, and drafted the manuscript. G.V. designed the study, researched data, contributed to discussion, and reviewed and edited the manuscript. S.Ho. and C.K. researched data, contributed to discussion, and reviewed and edited the manuscript. L.P., S.Ha., M.M., and R.R. contributed to discussion and reviewed and edited the manuscript. All authors approved the current version of the manuscript. M.S. and K.M. are the guarantors of this work and, as such, had full access to all the data in the study and take responsibility for the integrity of the data and the accuracy of the data analyses.