


Preclinical studies have suggested that thrombospondin-2 (TSP2) is implicated in liver fibrosis. However, the clinical relevance of TSP2 in nonalcoholic fatty liver disease (NAFLD) remains undefined. Here, we investigated the cross-sectional and longitudinal associations of circulating TSP2 levels with advanced fibrosis (F3 or greater [≥FE] fibrosis) in NAFLD.
Serum TSP2 levels were measured in 820 patients with type 2 diabetes and NAFLD. All participants received vibration-controlled transient elastography (VCTE) at baseline to evaluate their hepatic steatosis and fibrosis using controlled attenuation parameter (CAP) and liver stiffness (LS) measurements, respectively. Among those without advanced fibrosis at baseline, reassessment VCTE was performed to determine whether ≥F3 fibrosis had developed over time. Multivariable logistic regression analysis was used to evaluate the cross-sectional and longitudinal associations of serum TSP2 level with ≥F3 fibrosis.
Baseline serum TSP2 level was independently associated with the presence of ≥F3 fibrosis (odds ratio [OR] 5.13, P < 0.001). The inclusion of serum TSP2 level significantly improved the identification of ≥F3 fibrosis by clinical risk factors. Over a median follow-up of 1.5 years, 8.8% developed ≥F3 fibrosis. Baseline serum TSP2 level was significantly associated with incident ≥F3 fibrosis (OR 2.82, P = 0.005), independent of other significant clinical risk factors of fibrosis progression, including BMI, platelet count, and CAP at baseline.
Circulating TSP2 level was associated with both the presence and the development of advanced fibrosis and might be a potentially useful prognostic biomarker for the development and progression of liver fibrosis in patients with type 2 diabetes and NAFLD.
Introduction
Type 2 diabetes is an important risk factor of progression in nonalcoholic fatty liver disease (NAFLD) (1–3). Liver fibrosis is the major determinant of overall mortality and adverse liver-related outcomes (4,5). Strikingly, >70% of patients with type 2 diabetes have concomitant NAFLD (6), or more specifically, metabolic dysfunction-associated fatty liver disease using the recently proposed definition (7). Therefore, there is a pressing need for prognostic biomarkers to identify those who are at a higher risk of developing advanced fibrosis because these patients are at a higher risk of developing long-term liver-related morbidity and mortality (4,5,8).
Thrombospondin (TSP) is a class of matricellular proteins that interacts with a number of ligands, including extracellular matrix structural proteins, cellular receptors, growth factors, and cytokines. TSP modulates cell-matrix interactions and possesses antiangiogenic properties (9,10). Among the five TSPs (TSP1–5), TSP1 and TSP2 share similar structure. Nonetheless, previous studies reported that TSP1 and TSP2 bind to different ligands and that there are spatial and temporal differences in their expression (11), such that their roles are not interchangeable (12,13). Hyperglycemia could induce both TSP1 and TSP2 expression (14,15), and increased tissue expression of TSP1 and TSP2 had been found in patients with type 2 diabetes (15,16).
With regard to NAFLD, genetic inhibition of TSP1 was shown to protect mice from developing nonalcoholic steatohepatitis (NASH) (17), and serum TSP1 levels were found to correlate positively with the degree of hepatic steatosis in patients with NAFLD (18). However, although significant upregulation of the hepatic expression of the THBS2 gene, which encodes TSP2, has been reported in patients with advanced fibrosis compared with those without (19), the clinical relevance of circulating TSP2 and NAFLD remains to be defined. A recent cross-sectional study demonstrated that the serum TSP2 level correlated significantly with hepatocyte ballooning, lobular inflammation, and fibrosis stage in 130 patients with biopsy specimen–proven NAFLD (20). Given the negative prognostic impact of type 2 diabetes on hepatic fibrosis progression, we therefore investigated both the cross-sectional and prospective associations of circulating TSP2 levels with advanced fibrosis in NAFLD, based on vibration-controlled transient elastography (VCTE), in a cohort consisting exclusively of patients with type 2 diabetes.
Research Design and Methods
Study Participants
All participants were recruited from the Hong Kong West Diabetes NAFLD Cohort, which consisted of patients with type 2 diabetes who were regularly monitored at the diabetes clinic of Queen Mary Hospital, Hong Kong. Type 2 diabetes was diagnosed by physicians based on clinical history, biochemical, and/or immunological findings. Consecutive patients who were Chinese, aged between 21 and 80 years, and attended diabetes complications screening since January 2017 were invited to undergo a prospective study that aimed to identify the risk factors of NAFLD fibrosis progression in type 2 diabetes. VCTE was used for the assessment of their hepatic steatosis and fibrosis at regular intervals. The study excluded patients who had known history of active malignancy, concomitant chronic hepatitis B or C, or any other liver disease, including α-1 antitrypsin deficiency, Wilson disease, autoimmune hepatitis, drug-induced liver injury, primary biliary cholangitis, or chronic use of steatogenic medications such as amiodarone, methotrexate, or tamoxifen. Also excluded were patients with daily alcohol consumption of >30 g in men or 20 g in women (21). The University of Hong Kong/Hospital Authority Hong Kong West Cluster institutional review board approved the study protocol. Written informed consent was obtained from all recruited participants before any study-related procedures.
In the current study, which evaluated the relationship between circulating TSP2 level and NAFLD in type 2 diabetes, only participants who had hepatic steatosis at baseline and were recruited between January 2017 and June 2020 were included. Moreover, in the analysis examining the prospective association of circulating TSP2 level with hepatic fibrosis progression, only participants who did not have advanced fibrosis or cirrhosis at baseline were included. The levels of hepatic steatosis and fibrosis were defined by controlled attenuation parameter (CAP) and liver stiffness (LS) measurements on VCTE, respectively (see below).
Clinical and Biochemical Assessments
All patients from the diabetes clinic had regular complications assessment as part of the standard clinical management to ascertain their glycemic control, cardiovascular risk factors, and the presence of diabetic complications. Anthropometric para meters, including body weight and height, BMI, waist circumference (WC), and blood pressure (BP), were measured. Fasting blood was drawn for plasma glucose, lipids, glycated hemoglobin (HbA1c), complete blood count, and liver and renal function tests. Estimated glomerular filtration rate (eGFR) was calculated using Chronic Kidney Disease Epidemiology Collaboration equation (22). Albuminuria status was assessed with a random urine sample and categorized according to the urine albumin-to-creatinine ratio as A1 (<30 mg/g), A2 (≥30 to <300 mg/g), and A3 (≥300 mg/g). All patients received regular retinal photographs and/or assessments by ophthalmologists approximately once every 1.5 years. For those who consented to participate in the NAFLD cohort study, a standardized questionnaire was used to obtain smoking status, alcohol consumption, and detailed medical, drug, and family histories. Hepatitis B surface antigen was determined for all participants without known hepatitis B status, whereas antibody against hepatitis C virus was checked in participants with elevated serum ALT or AST levels. Participants were further excluded if their hepatitis B surface antigen or antibody against hepatitis C virus was positive. Fasting blood was stored in aliquots at −70°C for assays of emerging NAFLD biomarkers. Conventional fibrosis scores, including NAFLD fibrosis score (NFS) and Fibrosis-4 index (FIB-4), were determined using published equations and categorized based on recommended cutoffs (23).
Measurement of Serum TSP2 Levels
Serum TSP2 levels were measured with an ELISA kit for human TSP2, using a pair of monoclonal antibodies that recognized distinct sites of human TSP2 (Antibody and Immunoassay Services, University of Hong Kong). The assay was highly specific to human TSP2, without any cross-reactivity to human TSP1, TSP3, TSP4, and TSP5. The lowest detection limit was 0.156 ng/mL, with its intra- and interassay precision being <4.6% and <7.2%, respectively.
VCTE
All participants received VCTE at baseline and every 12–18 months thereafter for reassessment. VCTE was performed after a fast of ≥8 h. CAP and LS were measured using FibroScan (Echosens, Paris, France) by two operators with experience in performing >500 measurements. The interobserver reliability was satisfactory, as reflected by an intraclass correlation of 0.98 for CAP and 0.97 for LS measurements. CAP and LS were both represented by the median of 10 reliable measurements, defined when the interquartile range was <30% and the success rate was >60%. Only CAP values with an interquartile range of ≥40 dB/m were used to ensure data validity (24). Since measurements with M probe have been validated in several large studies and can be used in >70% of patients with NAFLD, all examinations were done using M probe in the first attempt. The XL probe was used only when the M probe failed to produce valid and reliable measurements, especially in participants with a BMI ≥30 kg/m2 (25).
Hepatic steatosis was graded by published CAP cutoffs: mild steatosis, 248–267 dB/m; moderate steatosis, 268–279 dB/m; and severe steatosis, ≥280 dB/m (26). Advanced fibrosis (F3) and cirrhosis (F4) were graded by LS cutoffs: F3 9.6–11.4 kPa and F4 ≥11.5 kPa (M probe); F3 9.3–10.9 kPa and F4 ≥11.0 kPa (XL probe) (6). Fibrosis progression was defined as the development of F3 or greater (≥F3) fibrosis (i.e., advanced fibrosis or cirrhosis) upon reassessment VCTE as of 31 December 2020.
Definitions of Clinical Variables
Central obesity was defined as WC ≥80 cm in women and ≥90 cm in men, hypertension as BP ≥140/90 mmHg or on antihypertensive medications, and dyslipidemia as fasting triglycerides (TGs) ≥150 mg/dL, HDL cholesterol (HDL-C) <40 mg/dL in men and <50 mg/dL in women, and LDL cholesterol (LDL-C) ≥100 mg/dL or on lipid-lowering agents. Diagnoses of coronary heart disease (CHD) and stroke were based on diagnostic codes from the ICD-9 (410, 36.01–10 for CHD and 430–438 for stroke) because screening for coronary and carotid atherosclerosis was not performed in our routine clinical practice.
Statistical Analysis
All data were analyzed with R 3.6.0 software (DeLong test for two correlated receiver operating characteristic [ROC] curves) and SPSS version 26.0 software (IBM Corporation, Armonk, NY). Data that were not normally distributed as determined by the Kolmogorov-Smirnov test, including serum TG, ALT, AST, and TSP2 levels, were logarithmically transformed before analysis. Values are reported as mean ± SD, median with 25th and 75th percentiles (for skewed data), or percentages, as appropriate. The χ2 test and ANOVA were used for comparisons of categorical and continuous variables, respectively. Pearson correlation and multivariable linear regression analyses were conducted to determine the associations between circulating TSP2 level and baseline clinical variables. Multivariable logistic regression analysis was performed to evaluate the independent determinants of the presence and development of ≥F3 fibrosis, based on models with the lowest Akaike information criterion. Variables that were statistically significant in univariate analysis were included in the multivariable logistic regression analysis.
The area under the ROC curve (AUROC) of serum TSP2, with and without the addition of clinical risk factors, was determined, and AUROCs of different clinical models were compared using the DeLong method. The optimal cutoff of the serum TSP2 level to identify the presence of ≥F3 fibrosis was derived from the point with maximum Youden J index (y) on the ROC curve with y = (sensitivity − [1 − specificity]). The predictive performance of the various models was further evaluated using category-free net reclassification improvement (NRI) and integrated discrimination improvement (IDI) (27,28). A two-sided P < 0.05 was considered significant.
Results
Serum TSP2 Level Was Significantly Associated With the Presence of ≥F3 Fibrosis in Type 2 Diabetes
The study recruited 1,053 eligible patients with type 2 diabetes, including 820 participants with hepatic steatosis at baseline (CAP ≥248 dB/m) and 233 without (CAP <248 dB/m). (Supplementary Fig. 1) Participants with hepatic steatosis were significantly younger, with higher BMI, WC, prevalence of hypertension, dyslipidemia, CHD, albuminuria, serum ALT, AST, eGFR levels, and LS values at baseline compared with those without. Their baseline serum TSP2 levels were also significantly higher compared with those without hepatic steatosis (2.47 vs. 2.05 ng/mL, respectively; P < 0.001) (Supplementary Table 1). In multivariable regression analysis, variables that were positively associated with the serum TSP2 level included serum AST (P < 0.001), presence of albuminuria (P = 0.002), and CAP (P < 0.001) and LS measurements (P < 0.001), whereas an inverse relationship was found between serum TSP2 level and sex (P < 0.001), eGFR (P = 0.011), and albumin levels (P < 0.001) (Supplementary Table 2). No significant interaction between sex and serum TSP2 levels was found (P = 0.433).
Among the 820 participants with hepatic steatosis at baseline, 138 (16.8%) had ≥F3 fibrosis. Table 1 summarizes the baseline characteristics of the study participants. Participants who had ≥F3 fibrosis were significantly younger, with higher BMI, WC, serum TG, ALT, AST, and lower HDL-C levels and platelet count than those who did not. Moreover, their duration of diabetes was significantly shorter, with a higher prevalence of albuminuria, users of ACE inhibitors/angiotensin II receptor blockers (ACEIs/ARBs) and calcium channel blockers than those without ≥F3 fibrosis. In contrast, there were fewer statin users among participants with ≥F3 fibrosis. Furthermore, participants with ≥F3 fibrosis had significantly higher CAP values and FIB-4 scores than those who did not (CAP: 339 vs. 299 dB/m [P < 0.001]; FIB-4 ≥1.3: 44.9 vs. 29.6% [P < 0.001]). Median serum TSP2 levels were significantly higher in participants with ≥F3 fibrosis than those without. (4.17 vs. 2.33 ng/mL, respectively; P < 0.001). Moreover, serum TSP2 levels in these 820 participants were not significantly different between men (2.39 ng/mL) and women (2.53 ng/mL; P = 0.055). Again, no significant interaction between sex and serum TSP2 level was found (P = 0.323).
Baseline characteristics of the study participants with NAFLD stratified by presence of ≥F3 fibrosis (N = 820)
| Variable | Without ≥F3 fibrosis (n = 682) | With ≥F3 fibrosis (n = 138) | P value |
|---|---|---|---|
| Clinical variables | |||
| Men | 51.2 | 52.2 | 0.806 |
| Age, years | 59.9 ± 10.2 | 57.8 ± 11.3 | 0.037 |
| Ever smoker | 24.5 | 29.0 | 0.267 |
| Duration of diabetes, years | 17.1 ± 9.5 | 15.1 ± 7.9 | 0.022 |
| BMI, kg/m2 | 27.7 ± 4.1 | 31.4 ± 5.2 | <0.001 |
| WC, cm | 95.3 ± 10.3 | 105.0 ± 15.0 | <0.001 |
| Central obesity | 85.6 | 95.7 | 0.001 |
| Systolic BP, mmHg | 136.0 ± 16.6 | 137.0 ± 15.5 | 0.553 |
| Diastolic BP, mmHg | 77.8 ± 9.7 | 78.9 ± 9.2 | 0.220 |
| Medical history | |||
| Hypertension | 80.9 | 81.2 | 0.952 |
| Dyslipidemia | 95.0 | 94.9 | 0.966 |
| Coronary heart disease | 18.2 | 16.7 | 0.643 |
| Stroke | 2.2 | 2.2 | 0.985 |
| Use of medications | |||
| Insulin | 56.5 | 52.2 | 0.356 |
| Metformin | 90.2 | 89.9 | 0.908 |
| Sulfonylureas | 32.1 | 40.6 | 0.055 |
| DPP-4is | 45.0 | 38.4 | 0.154 |
| GLP-1RAs | 0.9 | 2.9 | 0.053 |
| Pioglitazone | 13.7 | 17.1 | 0.286 |
| SGLT-2is | 18.2 | 16.4 | 0.612 |
| ACEIs/ARBs | 66.4 | 78.3 | 0.006 |
| β-Blockers | 30.6 | 38.4 | 0.075 |
| Calcium channel blockers | 51.3 | 62.3 | 0.018 |
| Diuretics | 14.8 | 21.0 | 0.069 |
| Statins | 76.0 | 64.5 | 0.008 |
| Biochemical variables | |||
| HbA1c, % | 7.63 ± 1.20 | 7.72 ± 1.21 | 0.440 |
| HbA1c, mmol/mol | 59.9 ± 13.1 | 61.0 ± 13.1 | 0.440 |
| HDL-C, mg/dL | 45.7 ± 11.4 | 41.6 ± 11.0 | <0.001 |
| LDL-C, mg/dL | 81.5 ± 28.1 | 79.3 ± 26.8 | 0.404 |
| TG,* mg/dL | 124 (92–175) | 151 (110–211) | <0.001 |
| ALT,* units/L | 22.0 (17.0–31.0) | 38.5 (28.0–55.5) | <0.001 |
| AST,* units/L | 21.0 (18.0–25.0) | 32.0 (25.0–42.5) | <0.001 |
| eGFR, mL/min/1.73 m2 | 82.0 ± 25.6 | 80.5 ± 26.6 | 0.536 |
| Albumin, g/L | 44.7 ± 3.2 | 45.0 ± 3.2 | 0.407 |
| Platelets, ×109/L | 265.0 ± 66.8 | 247.0 ± 68.1 | 0.004 |
| Transient elastography | |||
| CAP, dB/m | 302.0 ± 41.1 | 338.0 ± 43.0 | <0.001 |
| Steatosis grade | <0.001 | ||
| Mild | 24.0 | 6.5 | |
| Moderate | 11.6 | 5.1 | |
| Severe | 64.4 | 88.4 | |
| Diabetes microvascular complications | |||
| Diabetic retinopathy | 54.0 | 53.6 | 0.942 |
| Albuminuria | 47.1 | 61.6 | 0.002 |
| Conventional fibrosis scores | |||
| NFS ≥ −1.455 | 62.6 | 70.0 | 0.145 |
| FIB-4 ≥1.3 | 29.6 | 44.9 | <0.001 |
| Biomarker | |||
| TSP2,* ng/mL | 2.33 (1.65–3.21) | 4.17 (2.75–6.49) | <0.001 |
Data are %, mean ± SD, or median (25th–75th percentile). Bold P values are statistically significant (P < 0.05). Albuminuria was defined as urine albumin-to-creatinine ratio ≥30 mg/g. To conversion HDL-C and LDL-C from mmol/L to mg/dL, multiply by 38.9; for the conversion of TG from mmol/L to mg/dL, multiply by 88.2. DPP-4i, dipeptidyl peptidase 4 inhibitor; GLP-1RA, glucagon-like peptide 1 receptor agonist; SGLT-2i, sodium–glucose cotransporter 2 inhibitor.
Log-transformed before analysis.
The associations of baseline clinical variables with increasing quartiles of serum TSP2 levels of the study participants are summarized in Supplementary Table 3. Higher quartiles of baseline TSP2 levels were significantly associated with higher BMI, WC, systolic BP, HbA1c, TG, ALT, and AST levels and the prevalence of albuminuria, but with lower HDL-C, eGFR, and albumin levels and platelet count at baseline. Moreover, higher quartiles of baseline TSP2 levels were significantly associated with higher stages of hepatic steatosis (P < 0.001 for CAP) and fibrosis (NFS ≥ −1.455, FIB-4 ≥1.3, and LS; all P < 0.05).
Multivariable logistic regression analysis was performed, including age, BMI, diabetes duration, platelet count, serum HDL-C, TG, ALT, AST, CAP, TSP2 levels, and albuminuria. Serum TSP2 level was independently associated with ≥F3 fibrosis at baseline (odds ratio [OR] 5.13 [95% CI 3.16–8.32], P < 0.001), together with BMI (OR 1.14 [95% CI 1.08–1.20], P < 0.001), AST (OR 8.01 [95% CI 4.10–15.60], P < 0.001), and CAP values (OR 1.008 [95% CI 1.002–1.014], P = 0.01) (Table 2). The results were similar if BMI was replaced by WC (OR 5.67 [95% CI 3.49–9.22, P < 0.001] for TSP2 and OR 1.06 [95% CI 1.04–1.08 P < 0.001] for WC), or after adjustment for sex (OR 4.16 [95% CI 2.19–7.91], P < 0.001) and use of medications (OR 4.91 [95% 3.0–8.02], P < 0.001). Moreover, in subgroup analyses, the association between serum TSP2 level and ≥F3 fibrosis remained significant regardless of the presence of obesity (Supplementary Table 4) and the levels of NFS or FIB-4, although the associations were apparently stronger in those with higher conventional noninvasive fibrosis scores (Supplementary Table 5). In the subgroup of 58 participants with VCTE performed using the XL probe, the serum TSP2 level was also independently associated with ≥F3 fibrosis (OR 10.0 [95% CI 1.57–63.6], P = 0.015). Furthermore, in a sensitivity analysis involving all cohort participants with and without hepatic steatosis at baseline (N = 1,053), the serum TSP2 level remained independently associated with the presence of ≥F3 fibrosis (OR 5.57 [95% CI 3.45–8.97], P < 0.001) (Supplementary Tables 6 and 7).
Multivariable logistic regression analysis showing the association of serum TSP2 level with presence of ≥F3 fibrosis in NAFLD at baseline (N = 820)
| Baseline variable | Model 1 | Model 2 | ||
|---|---|---|---|---|
| OR (95% CI) | P value | OR (95% CI) | P value | |
| BMI, kg/m2 | 1.14 (1.08–1.20) | <0.001 | 1.15 (1.09–1.21) | <0.001 |
| AST,* units/L | 8.01 (4.10–15.6) | <0.001 | 7.93 (4.00–15.7) | <0.001 |
| CAP, dB/m | 1.01 (1.002–1.014) | 0.010 | 1.01 (1.002–1.014) | 0.013 |
| TSP2,* ng/mL | 5.13 (3.16–8.32) | <0.001 | 4.91 (3.00–8.02) | <0.001 |
| Use of sulfonylureas | 1.64 (0.99–2.68) | 0.059 | ||
| Use of statins | 0.61 (0.37–1.02) | 0.062 | ||
Bold P values are statistically significant (P < 0.05). Model 1: variables included in the analysis were age, BMI, duration of diabetes, albuminuria (defined as urine albumin-to-creatinine ratio ≥30 mg/g), HDL-C, TG, ALT, AST, platelet count, CAP, and TSP2 levels. Model 2: variables included in the analysis were those in model 1 plus use of sulfonylureas, glucagon-like peptide 1 receptor agonists, ACEIs/ARBs, β-blockers, calcium channel blockers, diuretics, and statins. Model selection in both was based on Akaike information criterion.
Log-transformed before analysis.
Performance of Serum TSP2 to Identify the Presence of ≥F3 Fibrosis on VCTE
Next, we investigated whether the serum TSP2 level was clinically useful in identifying individuals with ≥F3 fibrosis on VCTE who might need referral to a hepatologist for further assessments. The AUROC of serum TSP2 alone to indicate ≥F3 fibrosis on VCTE was 0.80 (95% CI 0.76–0.84), which was superior to both FIB-4 and NFS (Fig. 1). Notably, when the serum TSP2 level was added to a clinical model consisting of BMI and AST, the two other independent determinants of ≥F3 fibrosis, the AUROC increased significantly from 0.86 (95% CI 0.83–0.89) to 0.89 (95% CI 0.86–0.92, P = 0.01), which was significantly better than adding ALT to the model (P = 0.014) (Fig. 1 and Supplementary Table 8). Moreover, this was accompanied by significant improvements in both the IDI (8.1% [95% CI 5.0–11.0], P < 0.001) and category-free NRI (60.7 [95% CI 53.1–78.3], P < 0.001; 24.6 for events and 36.1 for nonevents). With the addition of the serum TSP2 level into the model of BMI and AST, among those with and without ≥F3 fibrosis, 86 and 464 participants were correctly reclassified, whereas incorrect reclassification occurred in 52 and 218 participants, respectively (Supplementary Table 9). The use of an optimal serum TSP2 cutoff of 3.6 ng/mL on its own to identify ≥F3 fibrosis yielded a sensitivity of 83.6%, specificity of 64.5%, positive predictive value of 44.3%. and negative predictive value of 92.1%.
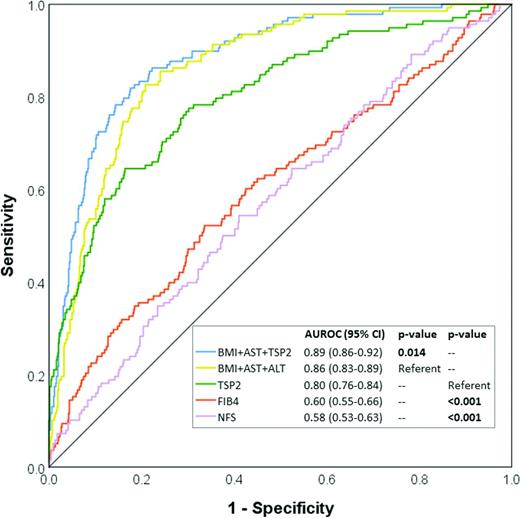
Circulating TSP2 level and other clinical risk factors for the identification of ≥F3 fibrosis in study participants with NAFLD (n = 820).
Circulating TSP2 level and other clinical risk factors for the identification of ≥F3 fibrosis in study participants with NAFLD (n = 820).
The performance of serum TSP2 as a marker of ≥F1/2 fibrosis was less satisfactory. The AUROC of serum TSP2 alone to indicate ≥F1/2 fibrosis on VCTE was 0.71 (95% CI 0.67–0.74). Moreover, when the addition of serum TSP2 versus ALT into a clinical model consisting of BMI and AST was compared, TSP2 led to a significant improvement in the AUROC to indicate ≥F3 fibrosis but not in the identification of ≥F1/2 fibrosis (P = 0.073). (Supplementary Table 8).
Baseline Serum TSP2 Level Was Independently Associated With the Development of ≥F3 Fibrosis in Patients With Type 2 Diabetes
Among the 682 participants who did not have ≥F3 fibrosis at baseline, 491 had received reassessment VCTE during the study period, after excluding 90 participants who refused to come back because of coronavirus disease 2019 (COVID-19), 17 who refused further VCTE, 19 lost to follow-up, 6 who had died, and 59 not due for reassessment VCTE. Over a median follow-up of 1.5 years, 43 (8.8%) of 491 participants had developed ≥F3 fibrosis.
Participants with incident ≥F3 fibrosis were significantly younger, had higher baseline BMI, WC, and ALT, AST, CAP, and NFS levels, and lower serum HDL-C and platelet count than those without. Importantly, participants who developed ≥F3 fibrosis had significantly higher baseline serum TSP2 level than those who did not (3.21 vs. 2.29 ng/mL, P < 0.001) (Supplementary Table 10).
In multivariable logistic regression analysis including age, BMI, serum HDL-C, ALT, AST, platelet count, CAP, and TSP2 levels at baseline, we found that the baseline serum TSP2 level was independently associated with development of ≥F3 fibrosis (OR 2.82 [95% CI 1.37–5.78], P = 0.005), together with baseline BMI (OR 1.12 [95% CI 1.03–1.21], P = 0.007), platelet count (OR 0.992 [95% CI 0.987–0.998], P = 0.01), and CAP values (OR 1.02 [95% CI 1.01–1.03], P < 0.001) (Table 3). Results were similar after adjustments for baseline use of pioglitazone (OR 1.97 [95% CI 1.06–3.65], P = 0.032).
Multivariable logistic regression analysis showing the association of baseline serum TSP2 level with hepatic fibrosis progression (n = 491)
| Baseline variable | Model 1 | |
|---|---|---|
| OR (95% CI) | P value | |
| BMI, kg/m2 | 1.12 (1.03–1.21) | 0.007 |
| Platelets, ×109/L | 0.992 (0.987–0.998) | 0.010 |
| CAP, dB/m | 1.02 (1.01–1.03) | <0.001 |
| TSP2,* ng/mL | 2.82 (1.37–5.78) | 0.005 |
| Baseline variable | Model 1 | |
|---|---|---|
| OR (95% CI) | P value | |
| BMI, kg/m2 | 1.12 (1.03–1.21) | 0.007 |
| Platelets, ×109/L | 0.992 (0.987–0.998) | 0.010 |
| CAP, dB/m | 1.02 (1.01–1.03) | <0.001 |
| TSP2,* ng/mL | 2.82 (1.37–5.78) | 0.005 |
Bold P values are statistically significant (P < 0.05). Variables included in the analysis were age, sex, BMI, HDL-C, ALT, AST, platelet count, CAP, and TSP2 levels. Model selection was based on Akaike information criterion.
Log-transformed before analysis.
Although the AUROC to predict the development of ≥F3 fibrosis did not change significantly with the inclusion of the baseline circulating TSP2 level (0.837 vs. 0.816, P = 0.19 for the model with and without TSP2, respectively), there were significant improvements in both the category-free NRI (37.3 [95% CI 6.4–68.1], P = 0.02) and IDI (2.2% [95% CI 0.1–4.4], P = 0.045) after the addition of the baseline circulating TSP2 level to the clinical model consisting of BMI, platelet count, and CAP values at baseline. Furthermore, in a sensitivity analysis with exclusion of 24 participants who had a history of brain injury and rheumatoid arthritis at baseline, conditions that could be associated with elevated TSP2 levels (29,30), baseline serum TSP2 level remained independently associated with both the presence and development of ≥F3 fibrosis (Supplementary Tables 11 and 12).
Conclusions
To our knowledge, our present study is the first to demonstrate the clinical relevance of the circulating TSP2 level as a fibrosis biomarker in NAFLD using both cross-sectional and prospective approaches. We observed that the serum TSP2 level was associated with the presence of ≥F3 fibrosis and was also an independent predictor of the development of advanced fibrosis in patients comorbid with NAFLD and type 2 diabetes.
In a recent multitranscriptome analysis of five microarray data sets, the THBS2 gene was among the five prioritized genes specifically associated with liver fibrosis independent of etiology, and its expression was positively associated with liver fibrosis staging (31). In mice treated with carbon tetrachloride and rats with bile duct ligation, both rodent models of liver fibrosis, hepatic TSP2 protein expression was increased (31). Similarly, in another study using apolipoprotein E knockout mice fed a high-fat high-cholesterol diet, hepatic THBS2 gene expression was higher in mice with severe fibrosis than those with mild fibrosis (19). In humans, significant upregulation of hepatic THBS2 gene expression was observed in patients with ≥F3 fibrosis compared with those with F0/1 fibrosis (19). Moreover, two recent cross-sectional studies demonstrated that the circulating TSP2 level significantly correlated with the severity of fibrosis in 130 patients with biopsy specimen–proven NAFLD (20) and was 1 of the 12 fibrosis markers found on a proteomics screen in 113 patients with NASH (32). Taken together with the above animal and human studies, our clinical findings on the associations of circulating TSP2 levels with liver fibrosis, in both cross-sectional and longitudinal studies with a much larger sample size, have provided further evidence to support the role of TSP2 in fibrosis progression of NAFLD.
However, the mechanism to account for the raised circulating TSP2 levels in patients with advanced fibrosis appears not straightforward and remains to be elucidated. Although TSP1 and TSP2 are both matricellular proteins involved in wound healing and remodeling processes, there are spatial and temporal differences in their tissue expression. In wound healing, it has been suggested that TSP1 might serve more as an acute-phase reactant, whereas TSP2, primarily produced by fibroblasts, is more responsible for the subsequent remodeling processes (11). Liver fibrosis is also a wound healing and remodeling process secondary to chronic hepatic injury, such as in NAFLD. However, unlike TSP1, which activates latent transforming growth factor-β, a classical fibrogenic cytokine, TSP2 has minimal influence on transforming growth factor-β activity (11,33).
In an experimental model of glomerulonephritis, although genetic ablation of TSP2 in mice accelerated endothelial cell proliferation and capillary repair after renal injury, it also resulted in heightened inflammation, matrix accumulation, and increased glomerulosclerosis compared with wild-type mice (33). Similarly, in another study of experimental brain injury, the lack of TSP2 dampened the recovery of the blood-brain barrier and prolonged neuroinflammation after foreign body implantation in mice, with elevated local production of matrix metalloproteinase-2 and -9 levels (29), which were both also implicated in the pathogenesis of liver fibrosis. Moreover, in rheumatoid arthritis, high TSP2 expression was produced by synovial fibroblasts, endothelial cells, and macrophages in patients with diffuse arthritis. However, in vivo models of human rheumatoid arthritis demonstrated that overexpression of TSP2 in fact resulted in marked reduction in lesion vascularization, tissue-infiltrating T-cell density, and the production of proinflammatory mediators, including tumor necrosis factor-α and interferon-γ (30). On the other hand, a recent in vitro study found THBS2 mRNA was highly expressed in hepatic stellate cells, and overexpression of THBS2 significantly promoted their activation (31).
In diabetes, previous studies had suggested TSP2 as a biomarker of proliferative diabetic retinopathy (PDR), because its levels in the vitreous fluid were significantly upregulated in patients with PDR and in those with active neovascularization (34). The authors proposed that myofibroblasts might augment TSP2 secretion to protect the tissues from excessive angiogenesis in PDR.
Recently, TSP2 expression in the skin was found to be significantly increased in patients with type 2 diabetes to almost threefold that of individuals without diabetes. In vitro analysis revealed that hyperglycemia could activate the hexosamine pathway and nuclear factor-κB signaling, thereby increasing TSP2 expression in fibroblasts (15), although it has also been shown that hyperglycemia could upregulate TSP2 expression through increased oxidative stress (35). Collectively, whether the effect of TSP2 on fibrogenesis is tissue specific, or the upregulation of hepatic and circulating TSP2 levels in patients with advanced fibrosis represents a compensatory response to underlying inflammation and oxidative stress in NASH, requires evaluation in further mechanistic studies.
Our study had several limitations. First, the observational study design did not allow for any causal relationship to be inferred between high circulating TSP2 level and the development of ≥F3 fibrosis in type 2 diabetes. Second, liver biopsy was not performed; however, the circulating TSP2 level was shown to correlate significantly with fibrosis staging in liver biopsy specimens (20). Moreover, VCTE is increasingly used as an accurate alternative tool for evaluation of hepatic fibrosis in NAFLD, with an AUROC of up to 0.93 for the detection of biopsy specimen–proven fibrosis (36). This is especially relevant in the assessment of the large number of stable and asymptomatic patients comorbid with type 2 diabetes and NAFLD or metabolic dysfunction-associated fatty liver disease (7). The prevalence of ≥F3 fibrosis in our cohort was also similar to the prevalence in other published studies based on VCTE for assessments of hepatic fibrosis in patients with type 2 diabetes (37,38). Interestingly, although liver fat usually decreases as fibrosis increases, participants in our study with ≥F3 fibrosis had significantly higher BMI and CAP levels than those without. Nonetheless, the association between serum TSP2 level and ≥F3 fibrosis remained significant after adjustments of BMI and CAP, and subgroup analysis showed significant associations regardless of the presence of obesity. Furthermore, because more than one-half of the study participants were on insulin therapy, fasting insulin level was not measured, and hence, the HOMA of insulin resistance was not assessed. Finally, the median observational period of 1.5 years could have contributed to the relatively low event rate of fibrosis progression compared with previous studies (39,40).
Nonetheless, despite the above limitations, the current study suggested that there is considerable potential to use the circulating TSP2 level as a biomarker of advanced fibrosis for hepatic risk stratification among the large number of patients comorbid with type 2 diabetes and NAFLD. With its high negative predictive value of >90% and the significant improvement of the AUROC to identify ≥F3 fibrosis on VTCE, this will be especially useful in diabetes clinics where VCTE is not readily available. Patients with a high circulating TSP2 level, indicating a greater risk of harboring ≥F3 fibrosis and fibrosis progression on VCTE, can be identified for referrals to hepatologists for further evaluation and prioritized for antidiabetic agents that could improve hepatic fibrosis, liver dysfunction, and/or steatosis (41–43), and new NAFLD treatments when clinically available (44–46).
Further studies with larger sample size and longer duration of follow-up are required to validate our findings, especially on the role of the circulating TSP2 level as a prognostic biomarker of NAFLD fibrosis progression. Moreover, further research and mechanistic studies should explore whether modulation of TSP2 represents a novel strategy to prevent hepatic fibrosis progression in type 2 diabetes.
This article contains supplementary material online at https://doi.org/10.2337/figshare.14673267.
Article Information
Acknowledgments. The authors thank Rachel Wong, Department of Medicine, University of Hong Kong, Hong Kong, for technical assistance in the measurements of serum TSP2 levels.
Funding. This work was supported by Hong Kong Research Grants Council/Area of Excellence (AoE/M/707-18).
Duality of Interest. C.-H.L. received speakers’ fees from AstraZeneca and Bayer. W.-K.S. received speakers’ fees from AstraZeneca and Mylan, is an advisory board member of CSL Behring, is an advisory board member and received speakers’ fees from AbbVie, and is an advisory board member and received speakers’ fees and research funding from Gilead Sciences. M.-F.Y. is an advisory board member and/or received research funding from AbbVie, Arbutus BioPharma, Assembly Biosciences, Bristol-Myers Squibb, Dicerna Pharmaceuticals, GlaxoSmithKline, Gilead Sciences, Janssen, Merck Sharp & Dohme, Clear B Therapeutics, Spring Bank Pharmaceuticals, and Roche and received research funding from Arrowhead Pharmaceuticals, Fujirebio Incorporated, and Sysmex Corporation. K.S.-L.L. is an advisory board member of Merck Sharp & Dohme. No other potential conflicts of interest relevant to this article were reported.
Author Contributions. C.-H.L. researched the data and wrote the manuscript. W.-K.S., D.T.-W.L., C.Y.-Y.C., W.-S.C., and Y.-C.W. researched the data. C.H.-Y.F. and H.Y.W. performed statistical analyses. M.-F.Y., A.X., and K.S.-L.L. critically reviewed and edited the manuscript. A.X. and K.S.-L.L. initiated and supervised the study. K.S.-L.L. and A.X. are the guarantors of this work and, as such, had full access to all the data in the study and take responsibility for the integrity of the data and the accuracy of the data analysis.