Mutations in the gene encoding glucokinase (GCK) cause a mild hereditary form of diabetes termed maturity-onset diabetes of the young (MODY)2 or GCK-MODY. The disease does not progress over time, and diabetes complications rarely develop. It has therefore been suggested that GCK-MODY represents a metabolically compensated condition, but experimental support for this notion is lacking. Here, we profiled metabolites in serum from patients with MODY1 (HNF4A), MODY2 (GCK), MODY3 (HNF1A), and type 2 diabetes and from healthy individuals to characterize metabolic perturbations caused by specific mutations. Analysis of four GCK-MODY patients revealed a metabolite pattern similar to that of healthy individuals, while other forms of diabetes differed markedly in their metabolite profiles. Furthermore, despite elevated glucose concentrations, carriers of GCK mutations showed lower levels of free fatty acids and triglycerides than healthy control subjects. The metabolite profiling was confirmed by enzymatic assays and replicated in a cohort of 11 GCK-MODY patients. Elevated levels of fatty acids are known to associate with β-cell dysfunction, insulin resistance, and increased incidence of late complications. Our results show that GCK-MODY represents a metabolically normal condition, which may contribute to the lack of late complications and the nonprogressive nature of the disease.
Maturity-onset diabetes of the young (MODY) is a group of monogenic forms of diabetes (1) that exhibit specific loss-of-function mutations with characteristic phenotypes. Thus far, 11 different MODY forms have been described (2). These are due to mutations in single genes for transcription factors and genes for insulin and proteins involved in insulin secretion, β-cell mass, and glucose metabolism. Mutations in the glucokinase gene (GCK; heterozygosity) typically result in a modest decrease in enzyme activity and elevated fasting glucose concentrations (MODY2 or GCK-MODY) (3). However, these patients hardly, if ever, develop late complications (4,5), require pharmacological treatment (6), or show the characteristic progression seen in other forms of diabetes. Therefore, MODY2 has been considered a compensated metabolic state, in which the increase in substrate (glucose) is sufficient to maintain a near-normal level of insulin secretion, but formal proof for this hypothesis is lacking.
Genetic testing is still the only reliable way to diagnose GCK-MODY (7,8). Several attempts have been made to identify biomarkers that can aid in selection of patients for a genetic screening of MODY, but their utility has been low (9). Therefore, there is a need to develop novel diagnostic tools that can identify specific forms of MODY.
Metabolomics has the advantage of providing analysis of metabolism as a whole contrary to the measurement of individual proteins or traditional methods, where one metabolite is measured at a time (10). Combining gas chromatography (GC) and mass spectrometry (MS) with multivariate statistics is a powerful tool for analyses of metabolites (11,12). An important property of metabolomics is that it is unbiased; it thus serves to generate hypotheses.
In the current study, we used metabolomics to characterize different forms of MODY with a particular emphasis on GCK-MODY. Specifically, we aimed to test whether GCK-MODY represents a metabolically compensated condition.
RESEARCH DESIGN AND METHODS
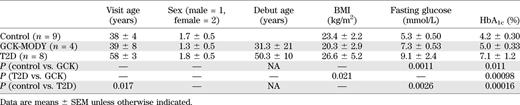
For screening, we included 9 nondiabetic control subjects, 4 carriers of a GCK-MODY mutation (R303 W), 12 hepatocyte nuclear factor (HNF)1α-MODY mutation carriers (two Pro291finsC, three L107I, three P379A, two R131Q, and two 72-73insTGGGGGT), 5 HNF4α-MODY mutation carriers (one R154X and four K99fsdelAA), and 8 GAD antibody–negative patients with type 2 diabetes (T2D) (Table 1) (13). The study was approved by the local ethics committee in Lund (LU 315/2003). All study subjects gave informed consent.
For replication, we included 28 healthy control subjects and 11 GCK-MODY (two G258C, two G261R, one R303T, four IVS3+IG>A, and two IVS3–2A>G) (Table 2). These studies were approved by the ethics committees in Lund and at Helsinki University Central Hospital.
Standardized meal test.
The screening group was fasted for 12 h and then served a standardized test meal. The 500-kcal breakfast meal was composed of orange juice (180 mL), toasted bread (60 g), jam or preserves (20 g), butter or margarine (10 g), whole milk (120 mL), and coffee or tea with nonnutritive sweetener if desired and was consumed within 15 min. Serum samples for metabolite profiling were collected at 0, 10, 15, 30, 60, 120, and 180 min after food intake. Subjects did not take insulin or oral antidiabetes drugs in the morning prior to the meal.
Metabolite profiling.
Metabolite profiling was performed by GC/MS as previously described in detail (14,15). Briefly, metabolites were extracted from 20 μL serum after addition of 80 μL methanol and a set of stable isotope-labeled internal standards. Metabolites were then evaporated to dryness, methoximated, and trimethylsilylated in a two-step derivatization reaction. Subsequently, metabolites were injected in splitless mode on a 30-m DB-5MS column (J&W Scientific, Folsom, CA), using an Agilent 7683B autosampler (Agilent, Atlanta, GA) and analyzed on an Agilent 6890N gas chromatograph (Agilent) connected to a Leco Pegasus III electron impact time-of-flight mass spectrometer (Leco, St. Joseph, MI). Data were exported from ChromaTOF (Leco) as NetCDF files, aligned, and integrated using scripts developed in MATLAB software 2006b (Mathworks, Natick, MA) (16). Peak identification was performed in National Institute of Standards and Technology MS Search 2.0 (2001), using the Golm database and databases developed in-house with both retention indices and mass spectral data. Data were normalized using corresponding internal standards, when applicable, and using scores obtained from a principal component analysis (PCA) performed on uncentered unit variance–scaled internal-standard peak areas (17).
Free fatty acids and triacylglyceride measurements.
Concentrations of serum free fatty acids (FFAs) and triacylglycerides (TAGs) were measured using commercially available kits (Biovision, Milpitas, CA). Concentrations of plasma glucose, HbA1c, and insulin were determined as previously described (18).
Statistical analyses.
Data are presented as means ± SEM. Statistical significance was tested by Student t test and ANOVA, where applicable. Data were analyzed by Prism 5 (GraphPad software, San Diego, CA). Multivariate analysis was performed in SIMCA P+ 12.0 (Umetrics, Umeå, Sweden). Data were centered, scaled to unit variance, and analyzed by PCA and orthogonal projections to latent structures–discriminant analysis (OPLS-DA).
RESULTS
Screening study.
In the screening group, patients with T2D had a diabetes duration of 7.9 ± 1.7 years, were slightly older (P < 0.05), and had higher fasting glucose and HbA1c compared with control subjects (Table 1). While HbA1c levels were 20% higher in GCK-MODY than in control subjects (P < 0.05), the levels were still below the recommended treatment target (5.0 ± 0.33%). Patients with GCK-MODY had 38% higher fasting blood glucose than control individuals (P < 0.01), with a mean value of 7.3 mmol/L. BMI in patients with HNF1α-MODY (24.8 ± 4.4) was slightly higher than in those with GCK-MODY (P = 0.046); patients with HNF4α-MODY (BMI 21.4 ± 0.93 kg/m2) were slightly leaner than those with T2D (P = 0.029). HbA1c levels were elevated in HNF1α-MODY (6.5 ± 0.51) compared with control subjects (P = 0.0012) and GCK-MODY (P = 0.016) but lower in patients with HNF4α-MODY (5.1 ± 0.49, P = 0.010) than in those with T2D. Fasting plasma glucose was elevated in HNF1α-MODY patients (9.2 ± 1.4, P = 0.015) compared with control subjects.
Fasting serum samples from nine healthy control subjects, 8 T2D patients, and 4 GCK-, 12 HNF1α-, and 5 HNF4α-MODY patients were analyzed by GC/MS: levels of 73 metabolite derivatives were identified and relatively quantified. (The identity and relative levels of these metabolites in GCK-MODY and control subjects are given in Supplementary Table 1.) For generation of an overview of the metabolic perturbations in the different forms of diabetes, data were analyzed by OPLS-DA (19). Thereby, samples can be classified by the systematic variation in the metabolite data that is dependent on diabetes type. The OPLS-DA model explained 67% of the variation in the metabolite data and 71% of the variation in the diabetes type, with a cross-validated ability to predict diabetes type of 46%. Furthermore, the score scatterplot (Fig. 1A) shows that, in the first three dimensions of the model, which describes 15.7 of the 18% of predictive variation in the metabolite data, T2D and HNF1α- and HNF4α-MODY were clearly separated from healthy subjects. Notably, differences in metabolite levels between GCK-MODY and healthy control subjects were not as pronounced; clustering of GCK-MODY and healthy control subjects was observed only in the fourth dimension corresponding to 3.3% of the predictive variation in the metabolite data (Fig. 1B). These data clearly demonstrate that metabolite profiles are different in the different type of diabetes analyzed.
For further elucidation of the differences between the metabolome of healthy individuals and GCK-MODY, a smaller set of samples containing only the GCK-MODY and the healthy control subjects was reanalyzed. Thereby, instrumental and chemical drift was reduced; now, 70 metabolite derivatives could be detected in all samples. (The identity and relative levels of these metabolites in GCK-MODY and control subjects are given in Supplementary Table 2.) From these data, an OPLS-DA model was calculated to isolate differences in metabolite pattern between the healthy and GCK-MODY groups (Fig. 2). When only two groups were compared, the model explained 99.8% of the variation in the metabolite data, with a predictive ability of 90%. A perfect classification of samples was observed in the score scatterplot (Fig. 2A), suggesting significant differences in metabolite pattern between these two groups.
Each data point in the score scatterplot represents the full set of 70 detected metabolite derivatives; to see which metabolites differ between the two clusters of data points, the loading plot (Fig. 2B) was investigated. This plot revealed that levels of several FFAs were lower and glucose higher in GCK-MODY compared with the healthy control subjects. Moreover, the quantitative (relative) data generated from the metabolite screening (Fig. 3) revealed that glucose measurements by GC/MS confirmed measurements performed in the clinic by established techniques (Fig. 3A). Thus, serum glucose was elevated by 30% (P < 0.05) and 64% (P < 0.01) in GCK-MODY and T2D, respectively, compared with the healthy control subjects. In contrast, levels of several FFAs were decreased (10–30%; P < 0.05) in GCK-MODY; the sum of FFA detected by GC/MS was 34% lower (P < 0.05) in GCK-MODY compared with T2D. An enzymatic assay covering fatty acids C8:0 and longer revealed a 53% (P = 0.061) decrease in FFA in GCK-MODY compared with healthy control subjects. In addition, we also assessed levels of TAGs. This analysis revealed that TAG levels were decreased by 52% (P < 0.05) in GCK-MODY while increased by 93% (P < 0.05) in T2D compared with healthy control subjects. HNF4α-MODY had 27% (P < 0.01) lower levels of TAGs than healthy control subjects; this has previously been observed (20). No difference between HNF1α and healthy control subjects could be observed.
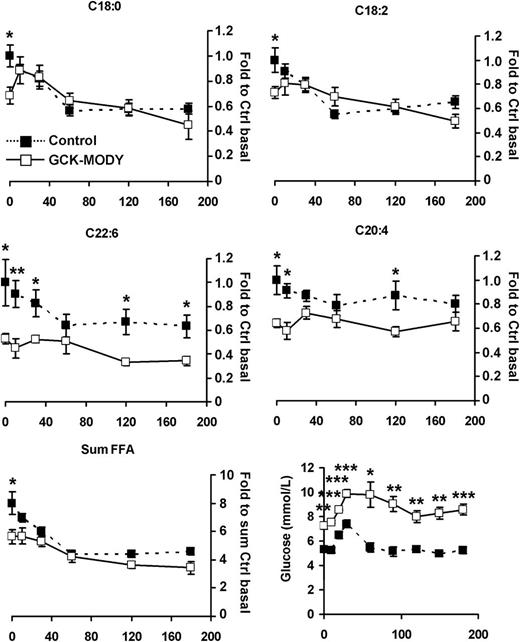
Thus far, the baseline samples that we analyzed suggest that patients with GCK-MODY are characterized by normal or supernormal glucose and fat metabolism as indicated by low FFA levels, which is usually a sign of high insulin sensitivity. Accordingly, the higher blood glucose levels imply that the reduced secretion of insulin is still sufficient to maintain a normal metabolic control. We then also wanted to investigate whether postprandial metabolic control was maintained. Therefore, metabolite profiling was also performed in the same subjects at several time points after a standardized meal test. The trajectories of glucose and FFA levels (Fig. 4) reveal that while glucose remained elevated, FFA levels generally remained lower in the GCK-MODY compared with the healthy control subjects.
Replication study.
To validate our finding of normal metabolic control in GCK-MODY, a larger set of GCK-MODY and healthy control subjects was collected from several different studies. This ensured that patients with GCK-MODY were recruited from different families and that the results were not specific for a given GCK mutation or any other genetic variant particular to those families. The material was matched for age, sex, date of blood sampling, and BMI (Table 2). In this material, levels of fasting blood glucose and HbA1c were 21% (P < 0.05) and 25% (P < 0.01) higher, respectively, in GCK-MODY than in healthy control subjects.
In these samples, 80 metabolite derivatives were relatively quantified and an OPLS-DA model was constructed to identify differences in metabolite patterns between GCK-MODY and healthy control subjects. (The identity and relative levels of these metabolites in GCK-MODY and control subjects are given in Supplementary Table 3.) The model explained 61% of the variation in the two groups, with an ability to predict GCK-MODY of 37%. The score plot (Fig. 5A) showed clustering of samples according to group. The loading plot (Fig. 5B) revealed that this clustering was mainly accounted for by increased glucose and decreased FFA levels. Plots of the raw data from the GC/MS analysis showed that blood glucose levels were elevated by 25% (P < 0.01) in GCK-MODY, again corresponding with values obtained in the clinic (Fig. 6A). Levels of individual FFAs were decreased 10–30% (P < 0.05), and the total level of FFA was decreased by 20% (P < 0.05). The enzymatic assays revealed 34% (P < 0.01) and 25% (P < 0.05) lower levels of FFA and TAGs, respectively, in GCK-MODY compared with healthy control subjects. Thus, we were able to confirm our findings from metabolite profiling in another cohort of patients. Normal metabolic control characterized by lower levels of FFAs, despite elevated blood glucose levels, remains an outstanding finding in the metabolic profile of GCK-MODY.
DISCUSSION
Unbiased profiling of metabolite levels, metabolomics, to examine changes of metabolism opens new doors for studies of whole-body metabolism in the development of different types of diabetes (21,22). Identification of MODY mutations, all of which perturb glucose homeostasis, has made it possible to study glucose metabolism under relatively homogenous conditions. In view of this homogeneity, we have performed metabolomic analyses of serum from patients with different types of MODY and compared them with the metabolic patterns in healthy individuals as well as patients with T2D.
Initially, we profiled serum metabolites in T2D patients, healthy control subjects, and GCK-, HNF1α-, and HNF4α-MODY to evaluate the extent and nature of metabolic perturbations in different forms of diabetes. The patients diagnosed with GCK-MODY had higher fasting glucose and HbA1c levels compared with control subjects, but HbA1c remained close to the threshold for diabetes (23). This is in concordance with previous findings (24). It is known that mutations of the GCK gene cause a disease characterized by high fasting glucose levels but with a near-to-normal response in an oral glucose tolerance test (25). Therefore, the clinical symptoms of the disease are mild, and it is not uncommon for patients with GCK-MODY to remain undiagnosed (26). Our findings reflect this, given that we observed that patients with GCK-MODY were leaner and displayed lower HbA1c levels than did patients with T2D.
Analyses of the metabolome in this study revealed that of all analyzed groups, patients with GCK-MODY clearly differed the least from healthy control subjects. This further corroborates the milder clinical symptoms in this form of MODY. There was a more pronounced difference between the metabolite profiles of patients with T2D compared with healthy individuals but also a clear difference between patients with T2D and GCK-MODY.
A closer evaluation of GCK-MODY and healthy control subjects revealed unanticipated lower levels of FFAs in GCK-MODY, despite significantly elevated levels of blood glucose. In addition, we could also show that decreased serum TAG levels paralleled this, confirming previous findings (27–29). The slightly higher age of the T2D population in our study should not affect the results because GCK-MODY has been shown not to progress over time, except for a slight increase in insulin resistance (30).
To further validate these findings, a larger GCK-MODY cohort was investigated. This cohort, containing a larger number of different GCK mutations, was collected from several studies performed in southern Sweden and Finland. Also in this cohort, decreased levels of FFAs were observed despite elevated blood glucose and HbA1c. Previously, it has been shown that mutations in GCK shift the concentration-response curve of glucose-stimulated insulin secretion to the right (31). Here, our data suggest that despite this shift in insulin secretion, metabolic control remains intact in GCK-MODY. This suggests that perturbed insulin secretion is more or less fully compensated for. Previously, compensatory mechanisms have been identified in the β-cell of GCK-MODY patients and mouse models (32,33); here, our data suggest the existence of compensatory mechanisms external to the β cell. GCK is also highly expressed in the liver, where it is an important component of hepatic glucose sensing (34); in the hypothalamus; in glucagon-like peptide 1–secreting L cells; glucose-dependent insulinotropic polypeptide–secreting K cells; and glucagon-secreting α cells (35–37). GCK may therefore function as a glucose sensor in several cell types involved in regulation of metabolism. Effects of mutations in GCK are expected in multiple cell types, independent of GLUT, as glucose uptake by both GLUT1 and GLUT2 exceeds the rate of glucose phosphorylation by GCK (38). Importantly, expression of liver GCK is controlled by insulin (39), thereby suggesting that the perturbation might be more severe in the liver than in the β cell (40). This could in part have influenced the results from studies on tissue-specific Gck knockout mice: the β-cell knockout showed a phenotype similar to that of human GCK-MODY, whereas the liver-specific phenotype showed much milder symptoms (41). In addition, insulin secretion was elevated twofold in the hepatic Gck knockout, suggesting that this mutation causes insulin resistance. Human GCK-MODY has also been characterized by slight insulin resistance, but hyperglycemia has been shown to be more related to the perturbed secretory response of the β cell (42). Despite the hyperglycemia observed in the mouse models, FFAs were not elevated (41). By contrast, overexpression of liver GCK increases glycogen deposits (43,44) and results in a lowering of blood glucose levels, while TAG and FFA levels are increased (44). These effects on blood lipid levels have been identified as a caveat in therapy for T2D using small-molecule activators of GCK (45). Recently, a polymorphism in the gene for the GCK regulatory protein was identified; it is associated with increased GCK activity and elevated levels of plasma TAG, FFA, and VLDL (46). Here, we can show that decreased activity of GCK is associated with the opposite effects on both TAG and FFA. Thus, the metabolic control in GCK-MODY seems to be intact, in contrast to common T2D, where elevated levels of both glucose and FFAs are observed (47). Reduced GCK activity is likely to reduce glycolytic flux and production of both glycogen (48) and malonyl-CoA. The latter is an important regulator of lipid metabolism; reduced levels alleviate inhibition of carnitine palmitoyl transferase 1, thereby increasing fatty acid oxidation. In addition, malonyl-CoA is the precursor of fatty acid synthesis; this will potentially also be reduced when GCK activity drops. Moreover, esterification of fatty acids into TAGs would be insufficient owing to reduced production of glycerol-3-phosphate via glycolysis. Thus, overall, hepatic fatty acid and TAG production and glucose metabolism would be decreased in the face of reduced GCK activity.
GCK-MODY patients have been shown to, despite elevated blood glucose, suffer less from diabetes complications (4,5). Although this could be partially explained by the milder hyperglycemia, lack of severe hyperglycemia at diagnosis, and absence of periods of severely compromised glucose control, there might be additional reasons. Elevated levels of lipids in combination with elevated glucose levels, glucolipotoxicity, have been shown to be toxic to the pancreatic β cell and may contribute to β-cell failure in T2D (49) and cause insulin resistance (50). In addition, elevated blood lipid levels lead to accelerated atherosclerosis and are thus associated with increased risk for cardiovascular disease (51). In GCK-MODY, blood glucose levels are elevated; however, this is compensated for by a reduction in blood lipid levels. Thus, in GCK-MODY, metabolic control is normal, which, at least in part, may explain the milder symptoms and lack of disease progression observed in GCK-MODY.
ACKNOWLEDGMENTS
This study received financial support from the Crafoord, Fredrik and Ingrid Thuring, Lars Hierta Memorial, O.E. and Edla Johansson, Albert Påhlssons, Åke Wiberg, and Magnus Bergvall foundations; the Royal Physiographic Society; and the Medical Faculty at Lund University and Region Skåne. This study was also supported by grants from the Swedish Research Council including a Linnaeus Grant (Lund University Diabetes Centre) (Dnr. 349-2008-6589) and a strategic research area grant (EXODIAB: Dnr. 2009-1039), as well as equipment grants from the KAW Wallenberg Foundation (2009-0243). L.G. also received funding from an EU grant (CEED3, FP7-2008-223211).
No potential conflicts of interest relevant to this article were reported.
P.S. performed metabolomic analysis and wrote the manuscript. E.E. and T.T. organized patient recruitment and performed clinical characterization in the screening study and the replication study, respectively. L.G. and H.M. provided advice and reviewed, edited, and assisted in writing the manuscript. K.F. performed lipid assays, cowrote the manuscript, and oversaw analyses and interpretations. P.S. is the guarantor of this work and, as such, had full access to all the data in the study and takes responsibility for the integrity of the data and the accuracy of the data analysis.


![FIG. 1. The extent of metabolic perturbations in different forms of diabetes. A: An OPLS-DA score scatterplot visualizing metabolic perturbations associated with different forms of T2D. In the first three dimensions, explaining the largest part of variation in the data, T2D and HNF4α- and HNF1α-MODY can clearly be distinguished from the healthy control subjects. In these dimensions, GCK-MODY and healthy control subjects are overlapping. B: In the fourth dimension, a separation between GCK-MODY and healthy control subjects is observed. Healthy control subjects, n = 9; T2D, n = 8; GCK-MODY, n = 4; HNF1α, n = 12; HNF4α, n = 5. All samples analyzed in duplicate. The axes, t[1], t[2], t[3], and t[4], depict the first, second, third, and fourth predictive component, respectively, of the OPLS-DA model. (A high-quality color representation of this figure is available in the online issue.)](https://ada.silverchair-cdn.com/ada/content_public/journal/diabetes/62/2/10.2337_db12-0827/4/m_653fig1.jpeg?Expires=1716991097&Signature=kn1dk1~YOiqKnwfxlHfh6P84~3DIn~JQ3v2bZ4KLnCf2IxDAOpmfsI82NTHYT5Tn1wm9XMM6yd9NAqpH5q7TwtopTAYNhlKp8Na1qBkjmi0c~ZY8ahbZLhc4HmXYt70Kz0XM9D~ZXH-q6JsorhGGCR4yUUx9Wi-qtdNK4uS9z-54ktvOZdpeMyCMrd8Y-Hy-Xn64jaGP0hcx4jQ6eNW63YBmjNqEUmibiFVhs4hsHqwwEFzaJDooI3EYXATbUSiJ2YOf~QCzCAyQJzRUd2WTblhqVSVVmxx9MTZ1K5UYh~SWxzfphzy~KTKkUdT0ZEo8jH0YmyPN0xJMBzr6FHLWZQ__&Key-Pair-Id=APKAIE5G5CRDK6RD3PGA)
![FIG. 2. Metabolic perturbations in GCK-MODY: screening. A: OPLS-DA score scatterplot revealing a clear separation of samples from GCK-MODY and healthy control subjects based on their metabolite pattern. t[1], predictive component; to[1], first orthogonal component. B: The loading scatterplot reveals the basis of the clustering observed in the score plot. Clearly, FFA levels (shown in the magnification to the right) are lower, whereas glucose levels (indicated by a gray arrow) are elevated in GCK-MODY compared with the healthy control subjects. p[1], predictive loading vector; po[1], first orthogonal loading vector. Healthy control subjects, n = 9; GCK-MODY, n = 4. Both groups analyzed in duplicate. (A high-quality color representation of this figure is available in the online issue.)](https://ada.silverchair-cdn.com/ada/content_public/journal/diabetes/62/2/10.2337_db12-0827/4/m_653fig2.jpeg?Expires=1716991097&Signature=s2FHp9UtEy2k4grI4aqkPsYxh~y6paqJ1Z1UNioL49u65Zxf0uAXnqipvFn0baZUXjzAOKHas4ShGnlJZj6MreF1CgxAWlPJutjX4KcRYEcMUJEOXZgl2N9kqJltlmlfestkx~4G9x6LqCwA2ZWQvAMmop1WrMg6pMYCA4KGMZYFPoVLTGachXlzN3jYIXJzfDw9i2Y32tDz5IdlTDiM~k5g6f95bhYN4TpAtOwWPx6qhWqStAuGEv2~SezwI~YuRy7J-txolU5k7A45E8Pni4b7-WuWrhF41orfSsTDcy1uCjvvIYRofPs-GdTHi8RN95cKSfghPVQF~5E74kJVAA__&Key-Pair-Id=APKAIE5G5CRDK6RD3PGA)

![FIG. 5. Metabolic perturbations in GCK-MODY: validation. A: OPLS-DA score plot revealing a separation of samples from GCK-MODY and healthy control subjects based on their metabolite pattern. B: The loading plot reveals the basis of the clustering observed in the score plot. Clearly, FFA levels are lower, whereas glucose levels are higher, in GCK-MODY compared with healthy control subjects. GCK-MODY, n = 11; healthy control subjects, n = 28. The axes, t[1], to[1], and p[1], depict the predictive component, the first orthogonal component, and the predictive component loadings, respectively, of the OPLS-DA model. (A high-quality color representation of this figure is available in the online issue.)](https://ada.silverchair-cdn.com/ada/content_public/journal/diabetes/62/2/10.2337_db12-0827/4/m_653fig5.jpeg?Expires=1716991097&Signature=nXh7LOEy7sZLCyzcqrqFfyCT-sdtZxKaNymuzMGVSnybL8eiJUjbmA4UOkWUnJV~OMdwcgxQY6tafe74BDitmnobb2H9s8dqddcuexRqlDAyb4lrCXcmm6oW7PIB2m2GX2wKdJNlDS6EYneTHsvEL9zM7APspAZj1Ne0LZM0afP61MoCtCX8k8zNRl3vcQcKtp5NhKXITgA05lzFaD4ZSYtNOQClkz0QGx5Wr16vaDLzeSbHMwybtOZtXbZdiXQHehag2uUDxSNhlxaRB6ubcJaggS8YPtnZHN204oaH5qrTzZsDiFO3eEIky0flxmRVZyyIC6vU0TQBEvFfFxzEyw__&Key-Pair-Id=APKAIE5G5CRDK6RD3PGA)