


Autoimmunity against pancreatic β-cell autoantigens is a characteristic of childhood type 1 diabetes (T1D). Autoimmunity usually appears in genetically susceptible children with the development of autoantibodies against (pro)insulin in early childhood. The offspring of mothers with T1D are protected from this process. The aim of this study was to determine whether the protection conferred by maternal T1D is associated with improved neonatal tolerance against (pro)insulin. Consistent with improved neonatal tolerance, the offspring of mothers with T1D had reduced cord blood CD4+ T-cell responses to proinsulin and insulin, a reduction in the inflammatory profile of their proinsulin-responsive CD4+ T cells, and improved regulation of CD4+ T cell responses to proinsulin at 9 months of age, as compared with offspring with a father or sibling with T1D. Maternal T1D was also associated with a modest reduction in CpG methylation of the INS gene in cord blood mononuclear cells from offspring with a susceptible INS genotype. Our findings support the concept that a maternal T1D environment improves neonatal immune tolerance against the autoantigen (pro)insulin.
Introduction
Maternal type 1 diabetes (T1D) confers protection against the development of T1D in offspring (1). The likelihood of developing T1D in children born to a mother with T1D (maternal T1D offspring) is around half that observed in children with a father or sibling with T1D and a nondiabetic mother (nonmaternal T1D offspring). Understanding the mechanism of this protection may lead to strategies that can prevent T1D.
Protection against T1D in maternal T1D offspring is observed in the early stages of the disease, with a reduced risk of developing (pro)insulin autoantibodies during the first years of life (2). (Pro)insulin autoantibodies are often the first signs of autoimmunity in children who develop T1D (3–5). The susceptibility for developing (pro)insulin autoantibodies is conferred by HLA class II and INS genes (6,7) via mechanisms that hinge on thymic presentation of the self-antigen to T cells. The absence of thymic self-antigen expression can lead to autoimmunity and multiple autoimmune diseases, including T1D (8–10). Susceptible INS genotypes are associated with decreased expression of (pro)insulin in antigen-presenting cells within the thymus (11,12), and it is thought that this leads to inadequate deletion of autoreactive T cells and/or impaired generation of self-antigen–specific T regulatory cells (Tregs). Similar mechanisms might also operate in the peripheral lymphoid tissues to augment tolerance (13).
Fetal hyperinsulinemia and increased circulating insulin and proinsulin levels are observed in the first months of life in maternal T1D offspring as a result of increased glucose transfer to the fetus (14–17). The majority of maternal T1D offspring are also exposed to insulin antibodies produced by the mother as part of the mother’s disease and in response to insulin replacement therapy (18–20). Although the effects of antibody transfer on diabetes incidence were inconsistent in mice (21) and humans (22), the insulin antibody-insulin immune complexes, which arise from antibody transfer, might extend exposure to the antigen in the offspring. We propose that increased exposure to insulin and proinsulin during gestation and early infancy in maternal T1D offspring leads to mechanisms that mimic central and peripheral tolerance to (pro)insulin. Here, we sought to corroborate this hypothesis by quantifying and profiling the CD4+ T-cell responsiveness to proinsulin and insulin at birth, and examining the regulation of CD4+ T-cell responses to proinsulin in the first year of life in maternal T1D offspring. We also examined whether maternal T1D is associated with cord blood epigenetic changes in the INS gene of offspring.
Research Design and Methods
Study Population
Samples for T-cell analyses were obtained from the ImmunDiabRisk (IDR) study (23), which included cord blood samples from maternal T1D offspring, nonmaternal T1D offspring, and children who did not have a first-degree relative with T1D (control offspring; Supplementary Table 1). Cord blood samples were collected from the placental side of the umbilical cord vein and processed within 24 h. Peripheral blood samples collected in Vacutainer Heparin Tubes (BD Bioscience) at a median age of 9 months were also examined. All samples were collected after obtaining written informed consent from the parents.
Cord blood from newborns who participated in the BABYDIET study (24) was also available for the analysis of DNA methylation, which was performed using the Illumina HumanMethylation 450 BeadChip as previously described (25). Written informed consent was obtained from all participants or their parents.
Frequencies and Phenotype of Antigen-Responsive CD4+ T Cells
Cord blood–derived CD14+ monocytes were isolated from fresh cord blood samples by positive isolation using magnetic-activated cell sorting (MACS; Miltenyi Biotec). The monocyte-depleted cord blood mononuclear cell (CBMC) component was frozen in human AB serum (PAA) supplemented with 10% DMSO (Sigma-Aldrich) and 0.1 ng/mL interkeukin (IL) 7 (R&D Systems), and stored in an Isothermal Liquid Nitrogen Freezer (Custom Biogenic Systems). Dendritic cells (DCs) were generated from the isolated CD14+ monocytes in DC medium (CellGenix) supplemented with 3% human AB serum, 2 mmol/L l-glutamine (Lonza) and 100 units/mL penicillin/streptomycin (Lonza) at 37°C, 5% CO2 and 95% humidity in the presence of 50 ng/mL granulocyte-macrophage colony-stimulating factor (GM-CSF) and 10 ng/mL IL-4 (both R&D Systems) as previously described (26). After 6 days, immature DCs were pulsed with 100 μg/mL insulin (Sigma-Aldrich), proinsulin (Biomm), or keyhole limpet hemocyanin (KLH; Calbiochem) or the glycated forms of the antigens (27). Monocyte-derived DCs (MO-DCs) were matured overnight in the presence of 100 units/mL IFN-γ (R&D Systems) and 10 ng/mL lipopolysaccharide (Sigma-Aldrich).
Following MO-DC maturation, cryovials of the same cord bloods were thawed and cell quantity and viability were assessed (Muse; median viability, 79%). CD25+ cells were depleted by MACS using CD25 Microbeads II (Miltenyi Biotec) according to the manufacturer’s protocols. The monocyte- and CD25+ cell–depleted CBMCs were washed with PBS (Gibco) and divided into three fractions, which were labeled with 10 μmol/L eFluor450 for 30 min at room temperature, 5 μmol/L eFluor670 for 10 min at 37°C in the dark (both eBioscience), or 1 μmol/L carboxyfluorescein succinimidyl ester (BioLegend) for 4 min at 37°C according to the manufacturers’ protocols. The investigative protocol used 150,000 cells (50,000 cells labeled with each dye) that were added to 3,000 autologous mature MO-DCs (1:50 final ratio) loaded with or without the antigens of interest in a total of 10 replicates per condition in round-bottom 96-well plates. The cocultures were incubated in a total volume of 200 µL RPMI 1640 supplemented with 5% human AB serum, 2 mmol/L l-glutamine and 100 units/mL penicillin/streptomycin at 37°C, 5% CO2 and 95% humidity in the presence of 0.1 ng/mL IL-7 for 5 days. Human serum AB was previously tested in single proliferation dye assays to exclude nonspecific T-cell activation. Cells were harvested and stained for 20 min at 4°C using anti-CD4 PerCP (clone SK3, catalog number 347324; BD Bioscience), anti-CD25 PE (M-A251, 555432; BD Pharmingen), and anti-CD45RO PE-Cy7 (UCHL1, 337168; BD Bioscience) monoclonal antibodies. Cells were washed and stained with Zombie NIR (BioLegend) to assess viability, fixed with 1.5% formalin (Sigma-Aldrich) in PBS, and acquired on a Becton Dickinson LSR Fortessa flow cytometer and analyzed with FlowJo software (Version 10; TreeStar Inc.).
For each antigen stimulus, the 10 replicate wells were analyzed for each proliferation dye (30 replicates per antigen). Antigen-responsive CD4+ T cells were identified as dyedim (proliferation) CD25+ (activation) CD45RO+ (conversion to memory) cells (Supplementary Fig. 1). For each sample, the median of the three dyes was calculated for each well and for each antigen, these values for the 10 replicate wells were compared with the 10 wells with unloaded MO-DCs using a Mann-Whitney U test. A positive response was assigned if the two-tailed P value of the comparison was <0.05. Additionally, the responses were expressed as the proportion of total proliferation dye-labeled CD4+ T cells after subtraction of the median value obtained from the 10 wells with unloaded MO-DCs.
For samples with sufficient cell numbers, separate proliferation assays of 1.5 × 10⁵ eFluor450- or eFluor670-labeled, monocyte- and CD25+ cell–depleted CBMCs and 3 × 10⁴ antigen-loaded MO-DCs were performed in four replicates as described for the multidye proliferation assays. Antigen-responsive cells were single-cell sorted into 96-well PCR plates (FrameStar) and processed and analyzed by real-time (RT) quantitative PCR (qPCR) using the Fluidigm Biomark HD with an established set of genes as previously described (28,29).
Regulatory CD4+ T-Cell Immune Suppression Assays
Frozen peripheral blood mononuclear cells (PBMCs) obtained at follow-up visits were thawed. CD25+ positive cells were enriched by MACS using CD25 Microbeads II and stained for 20 min at 4°C with anti-CD4 Brilliant Violet 510 (SK3, 562970; BD Bioscience), anti-CD25 PE (M-A251, 555432; BD Pharmingen) and anti-CD127 PE-Cy7 (A019D5, 351320; BioLegend) monoclonal antibodies. Live CD25+CD127lowCD4+ cells were sorted on a BD FACS ARIA III. The remaining CD25+CD127low cell–depleted fraction was separated into CD8+ and CD8− cells by MACS using CD8 Microbeads II (Miltenyi Biotec) and each fraction was labeled with 10 μmol/L eFluor450 for 30 min at room temperature. 1.5 × 10⁵ eFluor450-labeled CD8-depleted or CD8+ cells were cocultured with the sorted autologous CD4+CD25+CD127low Treg cells at Treg:Tresponder ratios of 1:2 and 0:1 (no Tregs) in X-Vivo15 media (Lonza) supplemented with 10% human AB serum, 2 mmol/L l-glutamine and 100 units/mL penicillin/streptomycin at 37°C, 5% CO2 and 95% humidity. Each ratio was tested in up to four wells. The autologous Treg/CD8+ cell–depleted cocultures were incubated for 5 days in presence of 10 μg/mL proinsulin (Biomm) and the autologous Treg/CD8+ T-cell cocultures were stimulated with anti-CD3/anti-CD28-coupled beads (Dynabeads; Invitrogen) at a bead/cell ratio of 1:50 for 3 days in 96-well plates. Cells were stained with anti-CD4 Brilliant Violet 510 (SK3, 562970; BD Bioscience), anti-CD8 PerCP (SK1, 347314; BD Bioscience), anti-CD25 PE (M-A251, 555432; BD Pharmingen), anti-CD45RO APC (UCHL1, 559865; BD Pharmingen), and anti-CD127 PE-Cy7 (A019D5, 351320; BioLegend). Cells were washed, stained with Zombie NIR to evaluate cell viability and then fixed with 1.5% formalin in PBS. Samples were acquired on a Becton Dickinson LSR Fortessa flow cytometer and analyzed with FlowJo software. Responsive T cells were identified as dyedimCD25+CD45RO+. Treg-induced suppression was calculated for each stimulus as the number of responder CD4+ or CD8+ T cells in cultures containing Treg cells divided by the number of responder cells in wells without Tregs.
Single-Cell Gene Expression
Single-cell gene expression profiling was performed by RT-qPCR as previously described (29) with some modifications. After reverse transcription with Quanta qScript TM cDNA Supermix directly on cells, the total cDNA was preamplified for 20 cycles using TATAA GrandMaster Mix (TATAA Biocenter) in the presence of primer pairs for 46 genes (25 nmol/L final concentration for each primer; Supplementary Table 2). Preamplified cDNA (10 μL) was treated with 1.2 units of exonuclease I and expression was quantified by RT-PCR on a BioMark HD System (Fluidigm Corporation) using the 96.96 Dynamic Array IFC and the GE 96 × 96 Fast PCR + Melt protocol with SsoFast EvaGreen Supermix and Low ROX (BIO RAD) and 5 μmol/L of primers for each assay. Raw data were analyzed using the Fluidigm RT-PCR analysis software. Preprocessing and data analysis were conducted using KNIME 3.7.0 and RStudio version 1.1.383 (RStudio). Preprocessing was done using a linear model to correct for confounding sampling effects as previously described (30).
Statistical Analysis
Data are provided as mean and 95% CIs. T-cell responses were compared among groups using parametric unpaired Student t tests. Two-tailed P values of <0.05 were considered significant. Methylation status was compared between groups using the Wilcoxon test. Data were analyzed using GraphPad Prism 7 (GraphPad) or R Studio version 3.2.2 (RStudio) software.
The uniform manifold approximation and projection method (UMAP) was used for dimensional reduction of single-cell gene expression data (31). Unsupervised ward clustering was done with hclust in R (version 3.5.1). To model the bimodal gene expression of antigen-responsive CD4+ T cells, the Hurdle model, a semicontinuous modeling framework, was applied to the preprocessed data using false discovery rate correction and a significance threshold of 0.01 (32). For individual genes that differed between groups, comparisons were also made using the Wilcoxon test.
Study Approval
All clinical investigations were performed in accordance with the principles of the Declaration of Helsinki, with written informed consent from all participants or their parents. The IDR study was approved by the Ethics Committee of the Technical University Munich, Munich, Germany (No. 5293/12) and the BABYDIET study was approved by ethics committee of the Ludwig-Maximilians University, Munich, Germany (No. 329/00).
Data and Resource Availability
The data sets generated and analyzed during the current study are available from the corresponding author upon reasonable request.
Results
Maternal T1D Reduces Proinsulin-Responsive CD4+ T Lymphocytes in Offspring Cord Blood
We first investigated whether maternal T1D offspring showed reduced responses to insulin and proinsulin. We established a cord blood CD4+ T-cell antigen assay with 30 replicates for each condition to account for the low expected frequency of antigen-specific cord blood T cells (Supplementary Fig. 1). Validating the ability to detect antigen-responsive cord blood CD4+ T cells, responses to the control multi-CD4+ T-cell epitope containing stimulus KLH (33) were observed in cord blood from offspring with no first-degree relatives with T1D (control offspring), as well as in maternal T1D offspring and nonmaternal T1D offspring (Fig. 1A).
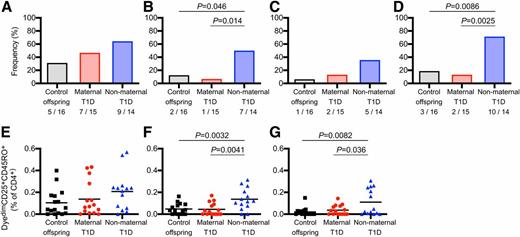
Antigen-responsive cord blood CD4+ T cells. The proportion of cord blood samples with responses (bar graphs, A–D) and the frequencies of antigen-responsive CD4+ T cells (scatterplots, E–G) after 5-day culture with matured MO-DCs loaded with KLH (A and E), proinsulin (B and F), insulin (C and G), and either proinsulin or insulin (D) for all tested cord blood samples are shown. For each antigen, a positive response was defined as a significant increase after comparing the frequency of responding CD4+ T cells in each of 10 wells in the presence of antigen-loaded MO-DCs to the 10 wells with control MO-DCs (see Supplementary Fig. 1). The number with a positive response out of the number tested is indicated. The frequency of antigen-responsive CD4+ T cells for each antigen shown in E–G was determined by calculating the median response in each of 10 wells and subtracting the median of the 10 wells with control MO-DCs. For scatterplots, the mean is indicated as the horizontal line. P values show comparisons made between groups using a two-sided Fischer exact test for responder status (A–D) and two-sided, unpaired Student t tests for the frequencies of antigen-responsive cells (E–G).
Antigen-responsive cord blood CD4+ T cells. The proportion of cord blood samples with responses (bar graphs, A–D) and the frequencies of antigen-responsive CD4+ T cells (scatterplots, E–G) after 5-day culture with matured MO-DCs loaded with KLH (A and E), proinsulin (B and F), insulin (C and G), and either proinsulin or insulin (D) for all tested cord blood samples are shown. For each antigen, a positive response was defined as a significant increase after comparing the frequency of responding CD4+ T cells in each of 10 wells in the presence of antigen-loaded MO-DCs to the 10 wells with control MO-DCs (see Supplementary Fig. 1). The number with a positive response out of the number tested is indicated. The frequency of antigen-responsive CD4+ T cells for each antigen shown in E–G was determined by calculating the median response in each of 10 wells and subtracting the median of the 10 wells with control MO-DCs. For scatterplots, the mean is indicated as the horizontal line. P values show comparisons made between groups using a two-sided Fischer exact test for responder status (A–D) and two-sided, unpaired Student t tests for the frequencies of antigen-responsive cells (E–G).
Cord blood CD4+ T-cell responses to proinsulin or insulin were observed in 3 (18.7%) of 16 control offspring, 2 (13.3%) of 15 maternal T1D offspring, and 10 (71.4%) of 14 nonmaternal T1D offspring (P = 0.0025 vs. maternal T1D offspring, P = 0.0086 vs. control offspring). Responses to proinsulin were observed in two (12.5%) of the control offspring, one (6.7%) maternal T1D offspring and seven (50%) nonmaternal T1D offspring (P = 0.014 vs. maternal T1D offspring, P = 0.046 vs. control offspring). The frequency of responses to insulin were not significantly different between groups. Additionally, the cord blood CD4+ T-cell responses to proinsulin (mean 0.14%, range 0–0.31%) and insulin (mean 0.11%, range 0–0.31%) were greater in nonmaternal T1D offspring than in control offspring (proinsulin: mean 0.05%, range 0–0.16%, P = 0.0032; insulin: mean 0.02%, range 0–0.15%, P = 0.0082). By contrast, the cord blood CD4+ T-cell responses to proinsulin (mean 0.05%, range 0–0.17%) and insulin (mean 0.04%, range 0–0.14%) in maternal T1D offspring were similar to those of control offspring and lower than those in nonmaternal T1D offspring (proinsulin, P = 0.0041; insulin, P = 0.036). There were no differences in the control stimulus KLH among the groups. The magnitude of responses to KLH were similar to those against proinsulin and insulin in the nonmaternal T1D offspring, but higher than those against proinsulin (P = 0.039) and insulin (P = 0.024) in the maternal T1D offspring and control offspring (P = 0.089, P = 0.012). The responses were similar and differences were maintained when the cells were stimulated with glycated antigen (Supplementary Fig. 2). These findings are consistent with the notion that maternal T1D reduced the number of CD4+ T cells with the capacity to respond to the proinsulin autoantigen.
Gene Expression of Antigen-Responsive CD4+ T Cells
We next asked whether there were qualitative differences in the responsive cord blood CD4+ T cells among the antigen and offspring groups. We first examined the expression of 46 genes in 680 single proinsulin- (n = 141), insulin- (n = 89), and KLH- (n = 450) responsive CD4+ T cells from 13 children with positive responses (Fig. 2). The cells were projected to nine clusters (Fig. 2A). There were differences in the relative proportions of cells responsive to each antigen between clusters (P < 0.0001). Proinsulin-responsive cells were most frequently found in clusters 1 (15.6% of proinsulin-responsive cells), 4 (24.1%), 6 (15.6%), and 7 (16.3%), and insulin-responsive cells were most frequent in clusters 3 (23.6% of insulin-responsive cells), 4 (32.6%), and 8 (21.3%), and absent in cluster 1 and 2. KLH-responsive cells were rather evenly distributed across the nine clusters. Clusters 1 and 2 were particularly striking and defined by the expression of CD40, IL22, CXCR5, TBX21, IFNG, and in cluster 1 also IL9. These features were mostly absent or infrequent in clusters 3–9 (Fig. 2C and Supplementary Fig. 3). Strong CD40 expression is unusual in CD4+ T cells and was previously reported as a feature of aggressive autoreactive T cells in mice (34–37) and in a minority of activated cells in humans (38). None of the proinsulin-responsive cells from both the one maternal T1D offspring and the one control offspring with a positive response was found in clusters 1 and 2, whereas the highest proportion of proinsulin-responsive cells from the nonmaternal T1D offspring was observed in cluster 1 (Fig. 3).

Gene expression in antigen-responsive cord blood CD4+ T cells. A total of 680 antigen-responsive CD4+ T cells were single-cell sorted and processed for qPCR. UMAP analysis of qPCR data from 46 genes (A) identified nine major clusters (cluster 1, black, 55 cells; cluster 2, brown, 38 cells; cluster 3, blue, 114 cells; cluster 4, light green, 110 cells; cluster 5, yellow, 41 cells; cluster 6, pink, 70 cells; cluster 7, gray, 76 cells; cluster 8, dark green, 123 cells; and cluster 9, red, 53 cells). Distribution of KLH-responsive (blue, 450 cells), proinsulin-responsive (yellow, 141 cells), and insulin-responsive (brown, 89 cells) CD4+ T cells is shown in the identified clusters (B). Gene expression intensities (white, no expression; brown, highest expression; gene order indicated on the right of the heatmap) were visualized as a heatmap organized by cluster as indicated in the horizontal bar beneath the heatmap (C). For each cluster, the cells are ordered by antigen as KLH (blue), proinsulin (yellow), or insulin (brown) as shown in the horizontal bar beneath the heatmap.
Gene expression in antigen-responsive cord blood CD4+ T cells. A total of 680 antigen-responsive CD4+ T cells were single-cell sorted and processed for qPCR. UMAP analysis of qPCR data from 46 genes (A) identified nine major clusters (cluster 1, black, 55 cells; cluster 2, brown, 38 cells; cluster 3, blue, 114 cells; cluster 4, light green, 110 cells; cluster 5, yellow, 41 cells; cluster 6, pink, 70 cells; cluster 7, gray, 76 cells; cluster 8, dark green, 123 cells; and cluster 9, red, 53 cells). Distribution of KLH-responsive (blue, 450 cells), proinsulin-responsive (yellow, 141 cells), and insulin-responsive (brown, 89 cells) CD4+ T cells is shown in the identified clusters (B). Gene expression intensities (white, no expression; brown, highest expression; gene order indicated on the right of the heatmap) were visualized as a heatmap organized by cluster as indicated in the horizontal bar beneath the heatmap (C). For each cluster, the cells are ordered by antigen as KLH (blue), proinsulin (yellow), or insulin (brown) as shown in the horizontal bar beneath the heatmap.

Gene expression signatures in proinsulin-responsive cord blood CD4+ T cells according to maternal T1D status. Expression measured by single-cell qPCR of 46 genes in proinsulin-responsive CD4+ T cells. UMAP analysis (A) from Fig. 2 showing cells from maternal T1D offspring (red, 30 cells), nonmaternal T1D offspring (81 cells, blue), and control offspring (gray, 30 cells), in each of the nine clusters described in Fig. 2. Gene expression intensities (white, no expression; brown, highest expression; gene order indicated on the right of the heatmap) were visualized (B) as a heatmap organized by cluster as indicated in the horizontal bar beneath the heatmap. For each cluster, the cells are presented in the order maternal T1D offspring (red), nonmaternal T1D offspring (blue), and control offspring (gray) as indicated below the heatmap.
Gene expression signatures in proinsulin-responsive cord blood CD4+ T cells according to maternal T1D status. Expression measured by single-cell qPCR of 46 genes in proinsulin-responsive CD4+ T cells. UMAP analysis (A) from Fig. 2 showing cells from maternal T1D offspring (red, 30 cells), nonmaternal T1D offspring (81 cells, blue), and control offspring (gray, 30 cells), in each of the nine clusters described in Fig. 2. Gene expression intensities (white, no expression; brown, highest expression; gene order indicated on the right of the heatmap) were visualized (B) as a heatmap organized by cluster as indicated in the horizontal bar beneath the heatmap. For each cluster, the cells are presented in the order maternal T1D offspring (red), nonmaternal T1D offspring (blue), and control offspring (gray) as indicated below the heatmap.
Clusters 3 and 9 were characterized by abundant expression of chemokine receptors and little or no cytokines (Fig. 2 and Supplementary Fig. 3). Cluster 4 was distinguished by the expression of ICOS, TNFRSF18 (GITR), and BCL6, along with other features of regulation, and clusters 3, 4, and 5 included 11%, 51%, and 7% cells, respectively, that expressed FOXP3 and IKFZ2 without IL7R and IL2 (Supplementary Fig. 4), which is a typical profile of Tregs. The majority of these Treg-like cells also expressed CCR4, which is a marker of memory T helper–like Tregs (39). The expression profile of proinsulin- and insulin-responsive Treg-like cells differed to the profile of KLH-responsive Treg-like cells, the former containing more cells from cluster 4 and expressing TNFRSF18 (GITR), TNFRSF4, and the immune checkpoint inhibitor PDCD1 (Supplementary Fig. 4). The proinsulin and insulin-responsive cells with a memory Treg profile included cells from both maternal and nonmaternal T1D offspring suggesting that both offspring groups have the capacity to convert naive T cells to memory (pro)insulin-responsive Treg.
Increased Regulation of In Vitro CD4+ T-Cell Responses to Proinsulin in Maternal T1D Offspring
Because the peak incidence of (pro)insulin autoantibody development is at 9–12 months of age (3,5,40), we investigated whether, in addition to the reduced proinsulin- and insulin-responsive cells at birth, there was evidence of increased regulation of proinsulin-responsive CD4+ T cells in the first year of life (Fig. 4). The CD4+ T-cell responses to proinsulin were examined in Treg-depleted PBMCs and in Treg-depleted PBMCs cocultured with Treg (Fig. 4A). Responses to proinsulin in the absence of Treg ranged from 0.01 to 0.68% with no difference between the maternal T1D offspring and nonmaternal T1D offspring (P = 0.36). In nonmaternal T1D offspring, the CD4+ T-cell response to proinsulin was reduced by 33.5% (range 16.7–51.7%) by coculture with Tregs. This reduction was significantly greater in maternal T1D offspring (mean 71.0%, range 43.3–91.4%, P = 0.0016). This difference remained significant when children with low responses to proinsulin (<0.03%) were excluded from the analysis (P = 0.0074). There was no difference in the reduction of CD8+ T-cell responses to polyclonal stimulation between maternal T1D offspring (mean 16.1%, range 9.7–23.9%) and nonmaternal T1D offspring (mean 13.4%, range, 2.9–19.2%, P = 0.48) (Fig. 4B), suggesting that the maternal T1D offspring do not show a general increase in Treg fitness or permissiveness of T effectors to regulation.

Regulation of CD4+ T-cell responses by maternal T1D offspring and nonmaternal T1D offspring CD4+CD25+CD127low cells in early childhood. Coculture experiments of FACS-purified CD4+CD25+CD127low Treg with responder dye-labeled CD4+ T cells stimulated with proinsulin (A) or responder dye-labeled CD8+ cells stimulated with anti-CD3/CD28 Dynabeads (B). Top panels show representative FACS plots of responder dye-dim T cells gated on CD4+ (A) or CD8+ (B) T cells without or in the presence of Tregs at a Treg:Tresponder ratio of 1:2. In the bottom panels, the y-axis shows the suppression of proliferating responder T cells calculated in cultures containing Treg cells compared with those without Tregs. Data are shown for samples from maternal T1D offspring (red circles, n = 6–7) and nonmaternal T1D offspring (blue triangles, n = 4–6) obtained at a median age of 9 months. The mean is indicated as the horizontal line in each scatterplot. P values were calculated using two-sided, unpaired Student t tests.
Regulation of CD4+ T-cell responses by maternal T1D offspring and nonmaternal T1D offspring CD4+CD25+CD127low cells in early childhood. Coculture experiments of FACS-purified CD4+CD25+CD127low Treg with responder dye-labeled CD4+ T cells stimulated with proinsulin (A) or responder dye-labeled CD8+ cells stimulated with anti-CD3/CD28 Dynabeads (B). Top panels show representative FACS plots of responder dye-dim T cells gated on CD4+ (A) or CD8+ (B) T cells without or in the presence of Tregs at a Treg:Tresponder ratio of 1:2. In the bottom panels, the y-axis shows the suppression of proliferating responder T cells calculated in cultures containing Treg cells compared with those without Tregs. Data are shown for samples from maternal T1D offspring (red circles, n = 6–7) and nonmaternal T1D offspring (blue triangles, n = 4–6) obtained at a median age of 9 months. The mean is indicated as the horizontal line in each scatterplot. P values were calculated using two-sided, unpaired Student t tests.
Maternal T1D Is Associated With Altered Cord Blood INS Gene Methylation Status
The limited cord blood CD4+ T-cell response to proinsulin in the maternal T1D offspring was consistent with the notion that there is a more effective immune tolerance, possibly as a result of increased exposure to insulin and/or proinsulin, in this setting. Insulin expression is affected by methylation (41,42). Although insulin is not expressed in cord blood cells, the methylation status at CpG sites in blood cells can be a useful measure of epigenetic differences between individuals (43), and we previously showed that cord blood methylation of multiple CpG sites within the INS gene is increased in children with T1D-susceptible INS genotypes (25). Therefore, we performed an exploratory investigation as to whether maternal T1D was associated with the methylation status of INS CpG sites in cord blood mononuclear cells (Fig. 5).

Methylation status of CpG sites within the INS gene in maternal and nonmaternal T1D offspring. Analysis of cord blood methylation of the CpG sites in INS cg25336198 (A) and cg02749887 (B) in maternal T1D offspring (red) and nonmaternal T1D offspring (blue) according to susceptible INS genotype AA (left) or other INS genotypes (right). The median value is indicated as the horizontal line in each scatterplot. P values were calculated using Wilcoxon tests.
Methylation status of CpG sites within the INS gene in maternal and nonmaternal T1D offspring. Analysis of cord blood methylation of the CpG sites in INS cg25336198 (A) and cg02749887 (B) in maternal T1D offspring (red) and nonmaternal T1D offspring (blue) according to susceptible INS genotype AA (left) or other INS genotypes (right). The median value is indicated as the horizontal line in each scatterplot. P values were calculated using Wilcoxon tests.
Among neonates with the susceptible INS genotype AA, methylation in maternal T1D offspring was reduced toward that observed in neonates with protective INS genotypes as compared with that in nonmaternal T1D offspring at cg25336198 (P = 0.04) and cg02749887 (P = 0.035). No differences were found among the maternal T1D states in neonates with protective genotypes. We extended the analysis to 40 CpG sites in 33 other T1D-susceptibility genes that previously showed marked allele-specific methylation variation (25). Differences between the maternal T1D offspring and nonmaternal T1D offspring were found at only three CpG sites (Supplementary Fig. 5) located in the SH2B3 (P = 0.047 in offspring with risk genotype), IFIH1 (P = 0.026 in children with a risk genotype), and ERBB3 (P = 0.016 in children with nonrisk genotypes) genes.
Discussion
We found that a maternal T1D environment is associated with a reduction in newborn CD4+ T-cell responsiveness to the T1D autoantigen proinsulin, and, in an exploratory analysis, a modest reduction in methylation at CpG sites of the INS gene in cord blood mononuclear cells from offspring with a T1D-susceptible INS genotype. These findings are consistent with the notion that maternal T1D protects against the development of insulin autoimmunity in offspring potentially by reversing the genetic propensity to release autoreactive (pro)insulin-specific T cells from the thymus.
This study is the first to address the effects of maternal T1D on T-cell responses to an autoantigen. Antigen-responsive cord blood T cells are infrequent and were previously shown to require competent antigen-presenting cells and T-cell growth factors to achieve a response (26). Thus, it was necessary to collect large volumes of cord blood to establish an assay with a considerable number of replicates, a feature that provided a readout with an unprecedented degree of confidence in quantifying these infrequent cells. A limitation of the methodology is its identification of antigen-responsive cells by proliferation. Therefore, it might miss some important antigen-specific cells that do not proliferate following an encounter with antigen-loaded DCs. In the current study, we removed Tregs from the cord blood T-cell assays so that we could assess cell response without the confounder of regulation. However, we were unable to determine whether the differences in proinsulin- and insulin-responsive cells were due to fewer precursor numbers or a higher activation threshold in cells from maternal T1D offspring.
We suggest that our findings support a mechanism involving improved immune tolerance to proinsulin and insulin. It was reported that a T1D-susceptible INS genotype is linked to decreased thymic expression of insulin (11,12), greater risk of developing insulin autoantibodies (7), and increased T-cell responses to proinsulin (44). Although modest, it is, therefore, of potential interest that a maternal T1D environment was associated with reduced methylation of CpG sites in INS in cord blood DNA of offspring with a T1D-susceptible INS genotype. The magnitude of the observed differences was small and the number of children in our study was too small to further stratify the responses by INS genotype or surrogate measures of fetal insulin and glucose. Moreover, cord blood methylation status provides an indirect marker of epigenetic changes, but these may not be relevant to actual expression in the relevant central or peripheral antigen-presenting cells for immune tolerance or may be transient (45). It would, therefore, be important to assess whether maternal T1D or hyperglycemia increases insulin expression in the neonatal thymus and whether the effects observed in cord blood persist during childhood.
In our assessment of the in vitro cord blood CD4+ T-cell response to antigens, we observed the appearance of an unusual CD4+ T-cell profile that was characterized by the coexpression of CD40, CXCR5, and IL22, along with cytokine genes, such as IFNG and IL9, and weak CD4 expression. A CD4lowCD40+ T-cell surface phenotype was previously identified and described as an aggressive autoreactive cell type (34,36–38). We did not examine protein expression, but it is possible that the cells we observed here have a similar phenotype. The CD40-positive cell clusters were enriched for proinsulin-responsive cells, reinforcing the potential relevance of proinsulin as an autoantigen (46–49), and no proinsulin-responsive cells from the one positive maternal T1D offspring or control offspring were found in these features. Cells with a memory Treg-like profile were observed in proinsulin- and insulin-responsive cells from both maternal T1D and nonmaternal T1D offspring suggesting the ability to convert naive T cells to Tregs if exposed to antigen and the potential to promote tolerance if exposed to antigen in vivo. Suppression assays performed at 9 months indicated that this may have been more efficient in the maternal T1D offspring. These findings require validation since gene expression does not define Treg and suppression assays are crude measures of Treg activity and are affected by many confounders, including T effector function (50).
Immune tolerance to autoantigens can be achieved by the deletion of autoreactive T cells and the generation of Tregs in the thymus (11) or periphery (13). We provide evidence that maternal T1D protects offspring from developing T1D by engaging tolerogenic mechanisms. It is also possible that exposure to high glucose affects fetal pancreatic β-cell maturation in a manner that provides additional protection against the development of T1D.
Article Information
Acknowledgments. The authors thank all of the recruiting physicians in pediatric hospitals and private practices for participating in the IDR, BABYDIAB, and BABYDIET studies.
Funding. This work was funded by JDRF grant 17-2013-525. E.B. is supported by the DFG Research Center and Cluster of Excellence - Center for Regenerative Therapies Dresden (FZ 111).
Duality of Interest. No potential conflicts of interest relevant to this article were reported.
Author Contributions. J.K., A.-G.Z., and E.B. designed the research study and helped conduct the experiments. J.K., A.G., S.D., and A.L. acquired the data. J.K., A.E., R.L., E.-M.S., K.W., N.H., A.-G.Z., and E.B. contributed to the analysis and interpretation of the data. J.K., A.E., A.-G.Z., and E.B. drafted the manuscript. J.K., A.E., A.G., R.L., E.-M.S., S.D., A.L., K.W., N.H., A.-G.Z., and E.B. critically reviewed and approved the manuscript. E.B. is the guarantor of this work and, as such, had full access to all the data in the study and takes responsibility for the integrity of the data and the accuracy of the data analysis.
Prior Presentation. Parts of this study were previously presented in poster and oral form at the Immunology of Diabetes Society Congress 2018, London, U.K., 25–29 October 2018.