


Despite guidelines recommending less stringent glycemic goals for older adults with type 2 diabetes, overtreatment is prevalent. Pragmatic approaches for prioritizing patients for optimal prescribing are lacking. We describe glycemic control and medication patterns for older adults with type 2 diabetes in a contemporary cohort, exploring variability by frailty status.
This was a cross-sectional observational study based on electronic health record (EHR) data, within an accountable care organization (ACO) affiliated with an academic medical center/health system. Participants were ACO-enrolled adults with type 2 diabetes who were ≥65 years of age as of 1 November 2020. Frailty status was determined by an automated EHR-based frailty index (eFI). Diabetes management was described by the most recent A1C in the past 2 years and use of higher-risk medications (insulin and/or sulfonylurea).
Among 16,973 older adults with type 2 diabetes (mean age 75.2 years, 9,154 women [53.9%], 77.8% White), 9,134 (53.8%) and 6,218 (36.6%) were classified as pre-frail (0.10 < eFI ≤0.21) or frail (eFI >0.21), respectively. The median A1C level was 6.7% (50 mmol/mol) with an interquartile range of 6.2–7.5%, and 74.1 and 38.3% of patients had an A1C <7.5% (58 mmol/mol) and <6.5% (48 mmol/mol), respectively. Frailty status was not associated with level of glycemic control (P = 0.08). A majority of frail patients had an A1C <7.5% (58 mmol/mol) (n = 4,544, 73.1%), and among these patients, 1,755 (38.6%) were taking insulin and/or a sulfonylurea.
Treatment with insulin and/or a sulfonylurea to an A1C levels <7.5% is common in frail older adults. Tools such as the eFI may offer a scalable approach to targeting optimal prescribing interventions.
The prevalence of type 2 diabetes among adults ≥65 years of age in the United States is estimated to be 26.9%, with adults ≥75 years of age representing the fastest growing population with type 2 diabetes (1). Glycemic management in older adults with type 2 diabetes presents unique challenges; because of the heterogeneity of aging (2), life expectancy for 75-year-old individuals may vary by >10 years depending on their underlying health and function (3,4). Complications of diabetes appear most often in older adults, with a concomitant higher cost of care, estimated at >$13,340 per person in 2017 (5).
Traditional approaches to the management of type 2 diabetes have advocated for tighter glycemic control to prevent microvascular complications. However, intensive glycemic control in older adults has been associated with increased hypoglycemic events (6), cognitive decline (7), and health care utilization, without documented improvement in cardiovascular disease or mortality (7–13). Insulin or sulfonylurea use, frailty, cognitive impairment, and polypharmacy have been associated with worse health outcomes in the setting of intensive glycemic control (13,14). The American Geriatrics Society (AGS) and American Diabetes Association (ADA) guidelines mandate an individualized approach to glycemic control and recommend less stringent glycemic goals (A1C ≥7.5% [58 mmol/mol]) in older adults with multimorbidity or frailty (15,16). Expert consensus supports frailty as a key determinant of target setting, with an appropriate A1C between 7.5 and 8.0% (13).
Despite well-known evidence, widespread implementation of these guidelines has yet to be achieved (4,17). Over 30% of adults with type 2 diabetes who are ≥75 years of age are routinely prescribed higher-risk medications such as insulin and sulfonylureas to attain more intensive glycemic goals, despite their underlying poor health and/or limited life expectancy (18,19). Paradoxically, within observational studies of older adults, those in good health were most likely to experience de-prescribing (a cessation of medications) or de-intensification (a reduction in dose) (17,19). Pragmatic methods have been lacking to differentiate older adults who may benefit from intensive glycemic control from those at risk for harm (20). Use of gold standard assessments such as the comprehensive geriatric assessment is impractical in most routine primary care practices because of the time and resources required to administer them (21).
As a practical and scalable alternative, automated approaches that leverage data recorded in an electronic health record (EHR) could provide an efficient means of identifying older adults with type 2 diabetes who are at highest risk from intensive glycemic control. In both England and the United States, there have been successful efforts leveraging the Deficit Accumulation Model of Frailty (22), integrating electronic frailty indices (eFIs) into an EHR. Higher eFI scores, indicating greater frailty, have been shown to be strongly associated with a number of adverse health outcomes, including mortality (23–25). The purpose of this study was to describe glycemic control patterns and medication use for older adults with type 2 diabetes within an accountable care organization (ACO), exploring variability by frailty as characterized by an eFI. Our hypothesis was that a sizable proportion of older adults would exhibit both intensive glycemic control and prescriptions for higher-risk medications, independent of frailty status. If so, the eFI could be deployed to pragmatically identify those with frailty as an appropriate target population for de-prescribing initiatives in type 2 diabetes.
Research Design and Methods
Data Source and Study Design
We conducted a retrospective analysis of EHR data for patients attributed to an ACO affiliated with our health system (Wake Forest Baptist Health, Winston-Salem, NC) as of 1 November 2020. We included patients who were ≥65 years of age with at least two cumulative visit diagnosis codes for type 2 diabetes (E11.x) (26) and at least one measurement of A1C in the 2 years before the index date. This study was approved by the Wake Forest Institutional Review Board.
Measurement of Frailty From the EHR
The construction of the eFI has been described previously (24,25). Briefly, the eFI quantifies the proportion of age-related deficits present for an individual based on the Deficit Accumulation Model of Frailty. Our implementation integrates 54 total deficits, constructed from diagnosis codes, vital signs, laboratory measurements, smoking history, medications, and functional assessments drawn from Medicare annual wellness visits (Supplementary Figure S1). The eFI is based on a lookback period of 2 years, with a requirement that a patient had at least two outpatient encounters with a measured blood pressure during that time frame in order to calculate the score (24,27). eFI scores range from 0 to 1, with higher scores indicating greater frailty. As in prior work, we categorized frailty status as fit (eFI ≤0.10), pre-frail (0.10 < eFI ≤ 0.21), and frail (eFI >0.21) (24,25,28).
Glycemic Control
We categorized glycemic control based on the most recent A1C value in the EHR within the 2-year lookback period before the index date, with categories of intensive (A1C <7.5% [58 mmol/mol]), moderate (7.5% ≤ A1C < 8.5% [58 mmol/mol ≤ A1C < 69 mmol/mol]), and poor (A1C ≥8.5% [69 mmol/mol]) glycemic control. In exploratory analyses, we also examined the prevalence of very intensive glycemic control (A1C <6.5% [48 mmol/mol]).
Diabetes Medication Regimens
Based on the active medication list for each patient as of the study index date, we classified glucose-lowering medications by pharmacologic class and subclass and by risk of hypoglycemia and other side effects. Metformin was classified as lower risk. Insulin and sulfonylureas were classified as higher risk. Within insulins, risk was further categorized by duration and rapidity of action, with long-acting classified as lower risk, intermediate-acting as moderate risk, and short- or rapid-acting as higher risk. The moderate-risk category comprised other glucose-lowering medications, listed here in order of decreasing side-effect risk profile: meglitinides (prandial glucose regulators), amylin analogs, thiazolidinediones, sodium–glucose cotransporter 2 inhibitors, α-glucosidase inhibitors, glucagon-like peptide 1 (GLP-1) receptor agonists, and dipeptidyl peptidase 4 inhibitors (gliptins). All combination medications (e.g., pre-mixed insulins and combination metformin/sulfonylurea or insulin/GLP-1 receptor agonist products) were classified within the higher-risk category.
Additional Patient Characteristics
We extracted demographic information from the EHR data, with race/ethnicity based on self-report. A 2-year lookback window was used for collecting continuous vital and laboratory measurements (e.g., blood pressure and BMI). International Classification of Diseases, 9th revision (ICD-9; before 1 October 2015) and 10th revision (ICD-10; after 1 October 2015), codes were used to identify the following comorbidities by their presence from the beginning of the EHR (September 2012) to the index date: macrovascular disease (i.e., coronary artery disease or myocardial infarction, cerebrovascular disease or stroke, or congestive heart failure) or microvascular disease (i.e., nephropathy or chronic kidney disease [CKD] defined by glomerular filtration rate [GFR] <45 mL/min/1.73 m2 per the ADA cutoff to consider metformin [16,29], neuropathy, and retinopathy) (30). We quantified multimorbidity via the Charlson Comorbidity Index (30). Serum creatinine values were used to calculate GFR (31).
Statistical Analysis
Frequencies with corresponding 95% CIs are reported. χ2 tests were used to test for associations of frailty status and other characteristics with level of glycemic control and specific medication regimen. We used Kaplan-Meier curves and Cox proportional hazards regression to model the association between the eFI and short-term mortality. All P values were from two-sided tests, and results were deemed statistically significant at P <0.05.
Results
We identified 72,995 patients ≥65 years of age who were affiliated with an ACO as of 1 November 2020, of whom 19,113 carried two or more ICD-10 diagnosis codes for type 2 diabetes. Our final analytic cohort included 16,973 patients, after those for whom an eFI could not be calculated (n = 1,003 [5.2%]) and those without an A1C measurement within the past 2 years (n = 1,137 [5.9%]). The mean age was 75.2 years (SD 6.9 years), 7,560 participants (44.5%) were ≥75 years of age, 9,154 (53.9%) were female, and 13,202 (77.8%) self-reported their race/ethnicity as White/Caucasian (Table 1).
Characteristics of Participants With Type 2 Diabetes, Stratified by Frailty Status
| Overall | Fit (eFI <0.10) | Pre-Frail (0.10 ≤ eFI <0.21) | Frail (eFI >0.21) | P | |
|---|---|---|---|---|---|
| N | 16,973 | 1,621 | 9,134 | 6,218 | |
| Age, years, mean ± SD | 75.2 ± 6.9 | 72.9 ± 6.0 | 74.6 ± 6.6 | 76.6 ± 7.2 | <0.001 |
| Sex, n (%) Male Female | 7,819 (46.1) 9,154 (53.9) | 919 (56.7) 702 (43.3) | 4,454 (48.8) 4,680 (51.2) | 2,446 (39.3) 3,772 (60.7) | <0.001 |
| Race/ethnicity, n (%) White or Caucasian Black/African American Other race Hispanic ethnicity | 13,202 (77.8) 3,098 (18.3) 673 (4.0) 339 (2.0) | 1,205 (74.3) 318 (19.6) 98 (6.0) 45 (2.8) | 7,013 (76.8) 1,730 (18.9) 391 (4.3) 197 (2.2) | 4,984 (80.2) 1,050 (16.9) 184 (3.0) 97 (1.6) | <0.001 <0.001 |
| Charlson Comorbidity Index, median (IQR) | 4 (2–6) | 2 (1–3) | 4 (2–5) | 6 (4–8) | <0.001 |
| Myocardial infarction, n (%) | 2,292 (13.5) | 111 (6.8) | 935 (10.2) | 1,246 (20.0) | <0.001 |
| Cardiovascular disease/stroke, n (%) | 3,942 (23.2) | 180 (11.1) | 1,607 (17.6) | 2,155 (34.7) | <0.001 |
| CKD/nephropathy,*n (%) | 3,194 (19.1) | 49 (3.1) | 1,188 (13.2) | 1,957 (32.1) | <0.001 |
| Cognitive impairment, n (%) | 3,122 (18.4) | 140 (8.6) | 1,285 (14.1) | 1,697 (27.3) | <0.001 |
| Recent eGFR,* mL/min/1.73 m2, mean ± SD | 63.6 ± 19.9 | 74.3 ± 15.1 | 66.7 ± 18.5 | 56.2 ± 20.4 | <0.001 |
| Neuropathy, n (%) | 4,921 (29.0) | 220 (13.6) | 2,122 (23.2) | 2,579 (41.5) | <0.001 |
| Retinopathy, n (%) | 1,844 (10.9) | 112 (6.9) | 832 (9.1) | 900 (14.5) | <0.001 |
| Recent A1C, %, median (IQR) [mmol/mol] | 6.7 (6.2–7.5) [50] | 6.7 (6.2–7.4) [50] | 6.7 (6.2–7.5) [50] | 6.7 (6.1–7.5) [50] | 0.96 |
| Overall number of medications, median (IQR) | 13 (10–17) | 9 (7–13) | 12 (9– 16) | 16 (12–20) | <0.001 |
| Diabetes medications, n (%) Insulin Low risk Intermediate risk High risk Sulfonylurea Thiazolidinedione Sodium–glucose cotransporter 2 inhibitor GLP-1 receptor agonist Dipeptidyl peptidase 4 inhibitor Metformin only† Metformin any† Other‡ | 4,106 (24.2) 1,664 (9.8) 139 (0.8) 2,303 (13.6) 4,571 (26.9) 929 (5.5) 864 (5.1) 1,348 (7.9) 1,682 (9.9) 8,730 (51.4) 9,177 (54.1) 89 (0.5) | 269 (16.6) 126 (7.8) 9 (0.6) 134 (8.3) 398 (24.6) 104 (6.4) 121 (7.5) 116 (7.2) 132 (8.1) 995 (61.4) 1,047 (64.6) 10 (0.6) | 1,829 (20.0) 782 (8.6) 73 (0.8) 974 (10.7) 2,563 (28.1) 561 (6.1) 512 (5.6) 693 (7.6) 916 (10.0) 5,180 (56.7) 5,434 (59.5) 49 (0.5) | 2,008 (32.3) 756 (12.2) 57 (0.9) 1,195 (19.2) 1,610 (25.9) 264 (4.2) 231 (3.7) 539 (8.7) 634 (10.2) 2,555 (41.1) 2,696 (43.4) 30 (0.5) | <0.001 <0.001 0.34 <0.001 0.001 <0.001 <0.001 0.02 0.04 <0.001 <0.001 0.78 |
| No glucose-lowering medications, n (%) | 3,823 (22.5) | 377 (23.3) | 1,991 (21.8) | 1,455 (23.4) | 0.050 |
Calculations based on number of patients with observable GFR (total = 16,698, fit = 1,571, pre-frail = 9,021, frail = 6,106, 1.5% missing overall).
Metformin only signifies that metformin was the only type of antihyperglycemic medication they were on; metformin any means they were on metformin in combination with any other antihyperglycemic drug.
Other medications include dopamine receptor agonists, meglitinides, α-glucosidase inhibitors, and amylin analog (pramlintide); these were grouped because the percentage using each was <0.5%.
With respect to frailty, the majority of patients were categorized as pre-frail (0.10 < eFI ≤0.21, n = 9,134 [53.8%]) or frail (eFI >0.21, n = 6,218 [36.6%]). Patients classified as frail were older on average, more likely to be female, more likely to identify as White/Caucasian, and had higher levels of comorbidity than those categorized as pre-frail or fit (Table 1). Frail older adults had a higher prevalence of both macrovascular and microvascular complications of type 2 diabetes. They also experienced a higher incidence of short-term all-cause mortality, with a cumulative incidence at 90 days of 2.4% (95% CI 2.0–2.8%), compared with 0.7% (95% CI 0.5–0.8%) and 0.3% (95% CI 0.1–0.5%) for pre-frail and fit patients, respectively (P <0.001) (Figure 1).
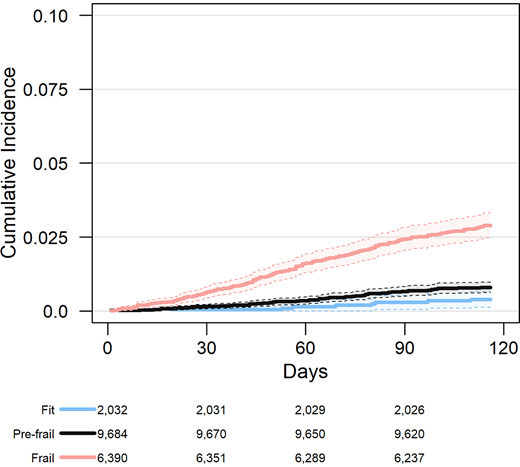
Association between frailty status based on the eFI and all-cause mortality in older adults with type 2 diabetes.
Association between frailty status based on the eFI and all-cause mortality in older adults with type 2 diabetes.
Glycemic Control
The majority of this older adult cohort had an A1C <7.5% (58 mmol/mol) (n = 12,575 [74.1%, 95% CI 73.4–74.7%), with poor glycemic control (A1C >8.5% [69 mmol/mol]) being less prevalent (10.9%, 95% CI 10.3–11.6%) (Figure 2). There was no association between frailty status based on the eFI and A1C <7.5% (58 mmol/mol), for those with an eFI score (P = 0.07). Among frail adults, 2,378 (38.2%, 95% CI 37.0–39.4%) had A1C <6.5% (48 mmol/mol).
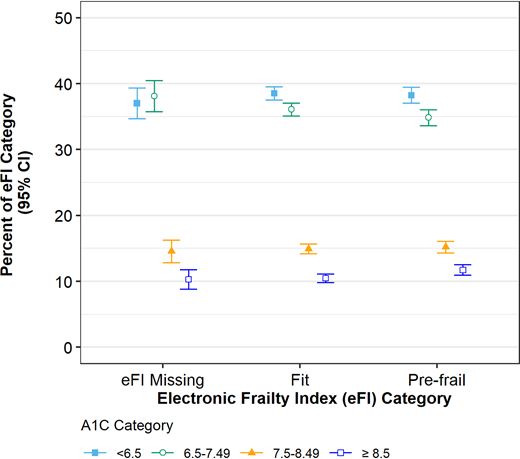
Glycemic control among adults ≥65 years of age with type 2 diabetes by frailty status, based on the eFI.
Glycemic control among adults ≥65 years of age with type 2 diabetes by frailty status, based on the eFI.
Medication Regimens
Overall, adults in our ACO population were taking a median of 13 medications (interquartile range [IQR] 10–17). Among frail older adults with an A1C <7.5% (58 mmol/mol), patients were taking a median of one glucose-lowering medication on a background of a median of 16 overall medications (IQR 13–20). Overall, 45.7% of adults were prescribed insulin and/or a sulfonylurea, including 33.8% of adults with an A1C <7.5% (58 mmol/mol).
We did observe variability in the use of insulin and/or a sulfonylurea by frailty status in adults with an A1C <7.5% (58 mmol/mol) (P <0.001). For the total population of older adults with type 2 diabetes, those classified as frail were the most likely to be prescribed insulin and/or a sulfonylurea, with 38.6% (95% CI 37.2–40.0%) prescribed such medications compared with 31.9% (95% CI 30.8–33.0%) and 26.4% (95% CI 23.9–28.8%) for pre-frail and fit adults, respectively (P <0.001). This trend remained for those with CKD (P = 0.04) and for those without CKD (P <0.001) (Figure 3).
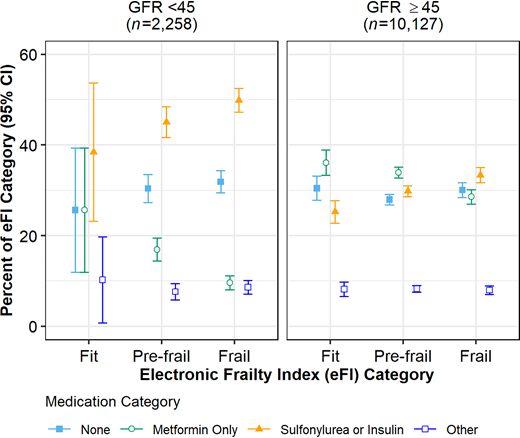
Diabetes medication regimens for adults ≥65 years of age with type 2 diabetes and recent A1C level <7.5% by CKD (GFR <45 mL/min/1.73 m2) and frailty status, based on the eFI.
Diabetes medication regimens for adults ≥65 years of age with type 2 diabetes and recent A1C level <7.5% by CKD (GFR <45 mL/min/1.73 m2) and frailty status, based on the eFI.
We also observed a similar prescribing pattern among older adults with an A1C <6.5% (48 mmol/mol) (n = 6,496). There was greater use of insulin and/or sulfonylureas among frail patients (26.0 [95% CI 24.3–27.8%]) compared with 20.9% (95% CI 19.6–22.3%) and 15.0% (95% CI 12.1–17.9%) in pre-frail and fit adults, respectively (P <0.001). Older adults categorized as frail were significantly less likely to be prescribed only metformin (P <0.001): 41.1% compared with those who were pre-frail (56.7%) or fit (61.4%). Overall, we estimated that 1,755 older adults (10.3%) in our ACO population would have been high-priority candidates for de-intensification of their diabetes regimen, as they met criteria for frailty, had an A1C <7.5% (58 mmol/mol), and were prescribed insulin and/or a sulfonylurea.
Discussion
This analysis demonstrates that intensive glycemic control and potential overtreatment remain highly prevalent, even in older adults with frailty based on deficit accumulation. This is 13 years after the ACCCORD (Action to Control Cardiovascular Risk in Diabetes) trial and despite nearly a decade of guidelines advising the avoidance of intensive glycemic control in older adults with type 2 diabetes and multimorbidity, functional limitations, and/or frailty (10,16,32). In this study, more than 10% of all older adults with type 2 diabetes would have been eligible for de-prescribing because of the use of higher-risk medications in frail older adults to achieve potentially inappropriately intensive glycemic goals. Observational studies have consistently shown a high prevalence of intensive glycemic control for older adults, including those with poor health and/or limited life expectancy (4,17–19,33).
Our findings show that, surprisingly, frail older adults were the most likely to be prescribed higher-risk medications, although they are also most likely to experience adverse effects. These results do align with other observational studies, in which older adults with frailty/multimorbidity were less likely to have changes to their type 2 diabetes regimen to reduce higher-risk medications than were older adults in good health (12,18,19,34,35).
Frail older adults in this cohort exhibited overall polypharmacy as well, since those with frailty took an average of 16 medications. This finding raises further concerns regarding adverse drug events, as the risk of drug-associated hypoglycemic events has been observed to increase in individuals taking five or more medications (14).
Some caveats deserve mention. First, this analysis did not adjust A1C for vitamin B12, valvular heart disease, iron deficiency, or other factors. Furthermore, this is a cross-sectional observational study leveraging routinely gathered EHR data. Confounding by indication may explain some of the increased prevalence of higher-risk medications, as those with more advanced type 2 diabetes may have both required higher-risk medications and developed frailty, at least in part, as a response to the severity of disease. However, a recent study described intensive glycemic control and higher-risk medications as highly prevalent, even in nursing home residents with severe cognitive impairment (36). In addition, given the use of a contemporary cohort, sufficient follow-up time has not yet accrued to allow an opportunity to explore health outcomes for frail older adults with intensive glycemic control and/or higher-risk medications. Future work is needed to explore patient-centered outcomes for older adults with type 2 diabetes, frailty, and intensive glycemic control and to test the impact of de-prescribing on these outcomes. However, this work does demonstrate the successful leveraging of EHR data to put forth a potential group appropriate for de-prescribing, while avoiding additional labor for front-line clinicians, which is a pragmatic approach to population health management of frail older adults with type 2 diabetes.
Contrary to guidelines and recommended practices, overtreatment of older adults with type 2 diabetes persists. The literature on de-prescribing for type 2 diabetes has yet to identify a scalable means of identifying older adults likely to benefit from this measure. Clinicians have lacked pragmatic guidance in implementation and scaling of a clinical response to the ADA and AGS guidelines (20,35), although consensus statements are emerging (13). Effective, efficient solutions are needed to help busy primary care clinicians select appropriate older adult patients for de-prescribing of their type 2 diabetes medications (37). eFI represents a novel, pragmatic, and scalable tool to facilitate population health efforts and enhance value with respect to identifying patients with type 2 diabetes who are candidates for de-prescribing.
Article Information
Funding
This work was supported by the National Center for Advancing Translational Sciences, National Institutes of Health (NIH) (UL1TR001420), the Wake Forest Center for Healthcare Innovation, and the Wake Forest Department of Internal Medicine. Additional support was provided by the Wake Forest Claude D. Pepper Older Americans Independence Center (P30AG021332) and the National Institute of Aging through K76-AG059986 (to K.E.C). The NIH, Wake Forest Center of Healthcare Innovation, and Wake Forest Department of Internal Medicine had no role in the design and conduct of the study; collection, management, analysis, and interpretation of the data; preparation, review, or approval of the manuscript; or decision to submit the manuscript for publication.
Duality of Interest
K.E.C. and J.D.W., and N.M.P. have received research support from the NIH. No other potential conflicts of interest relevant to this article were reported.
Author Contributions
K.E.C., K.M.L., C.O.U., and N.M.P. conceptualized this study. C.O.U., J.D.W., L.Y.B., A.W.M., M.H., and Z.N. contributed to editing the manuscript. A.W.M. contributed in the clinical informatics component of this study. K.E.C., K.M.L., and N.M.P. drafted the manuscript. All authors approved the final manuscript. K.M.L. and N.M.P. are the guarantors of this work and, as such, had full access to all of the data in the study and take responsibility for the integrity of the data and the accuracy of the data analysis.
Data-Sharing Statement
De-identified data will be made available upon e-mail request to the study principal investigator and upon completion of a data use agreement.
Supplementary Material
This article contains supplementary material online at https://doi.org/10.2337/figshare.19232748.